Portfolio
- github / linkedin / npr / insider / business insider
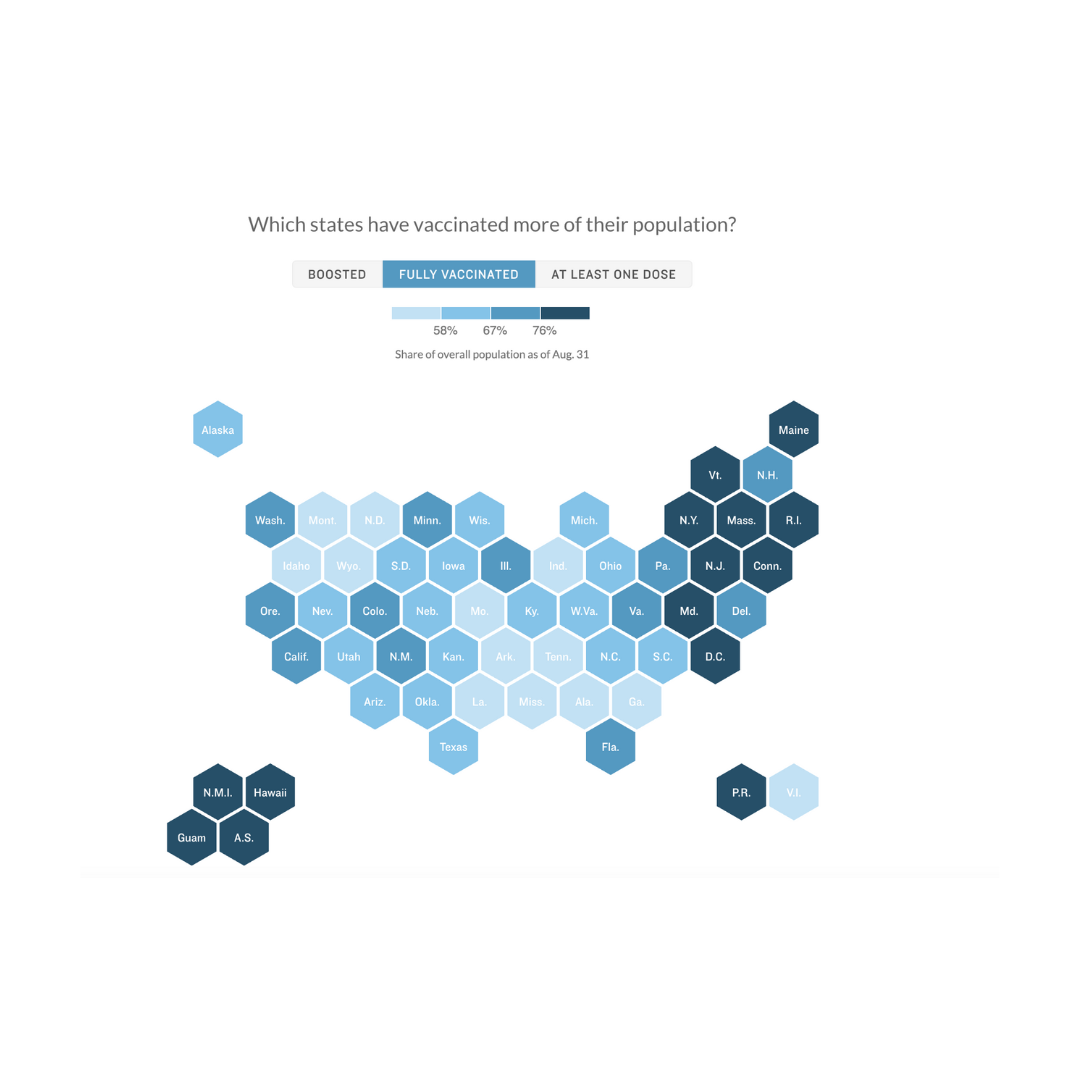
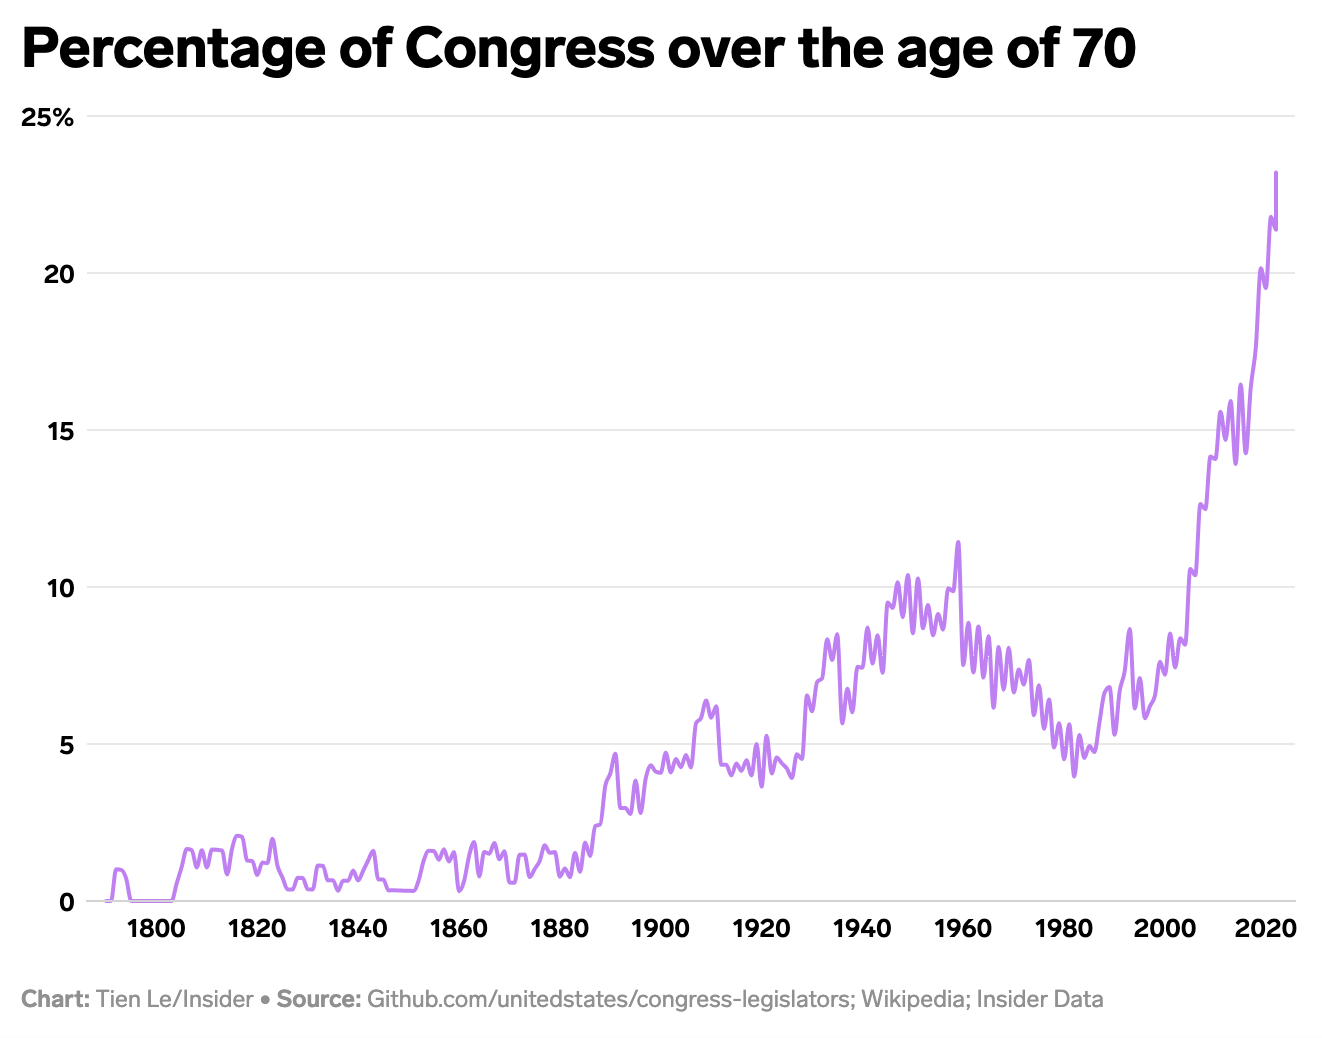
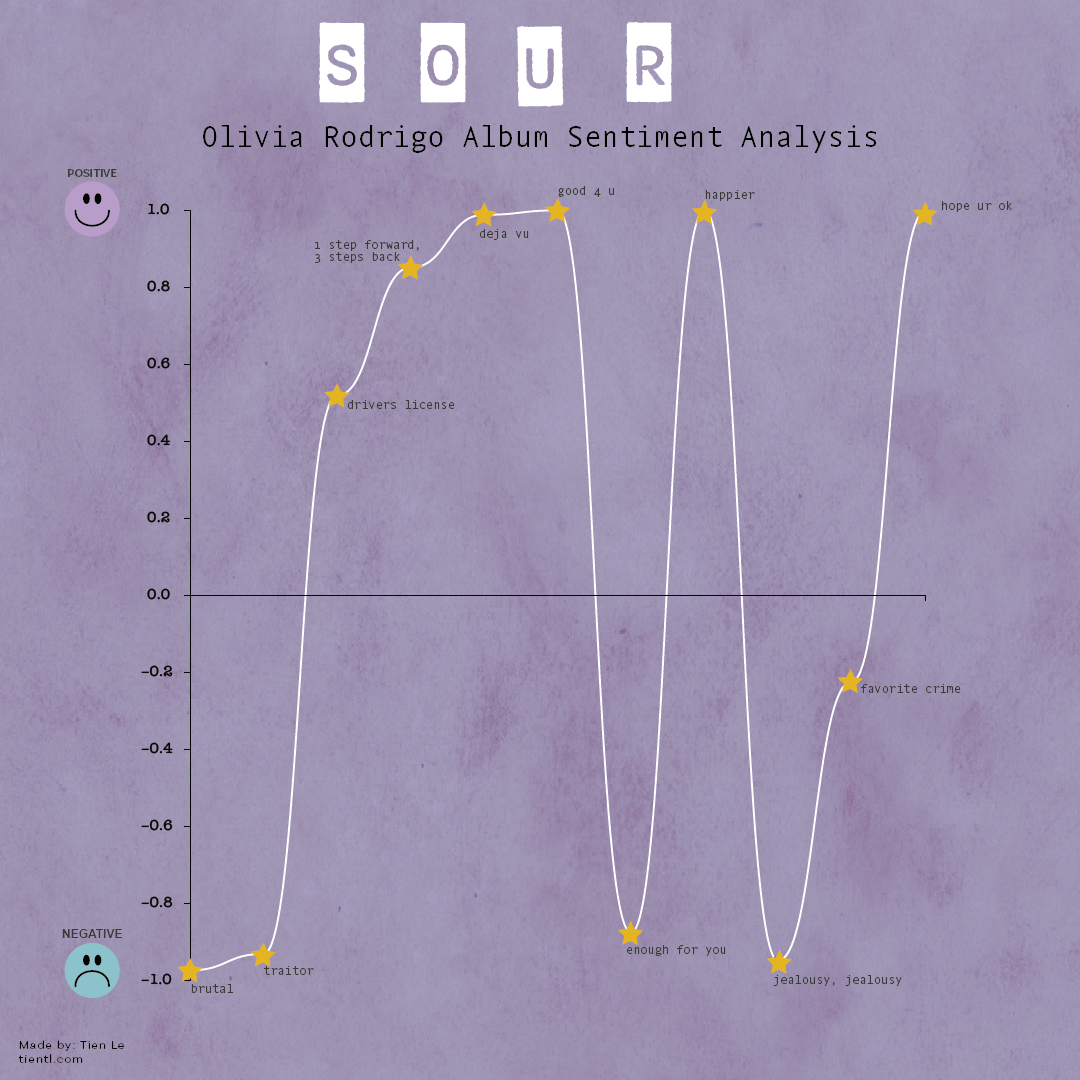
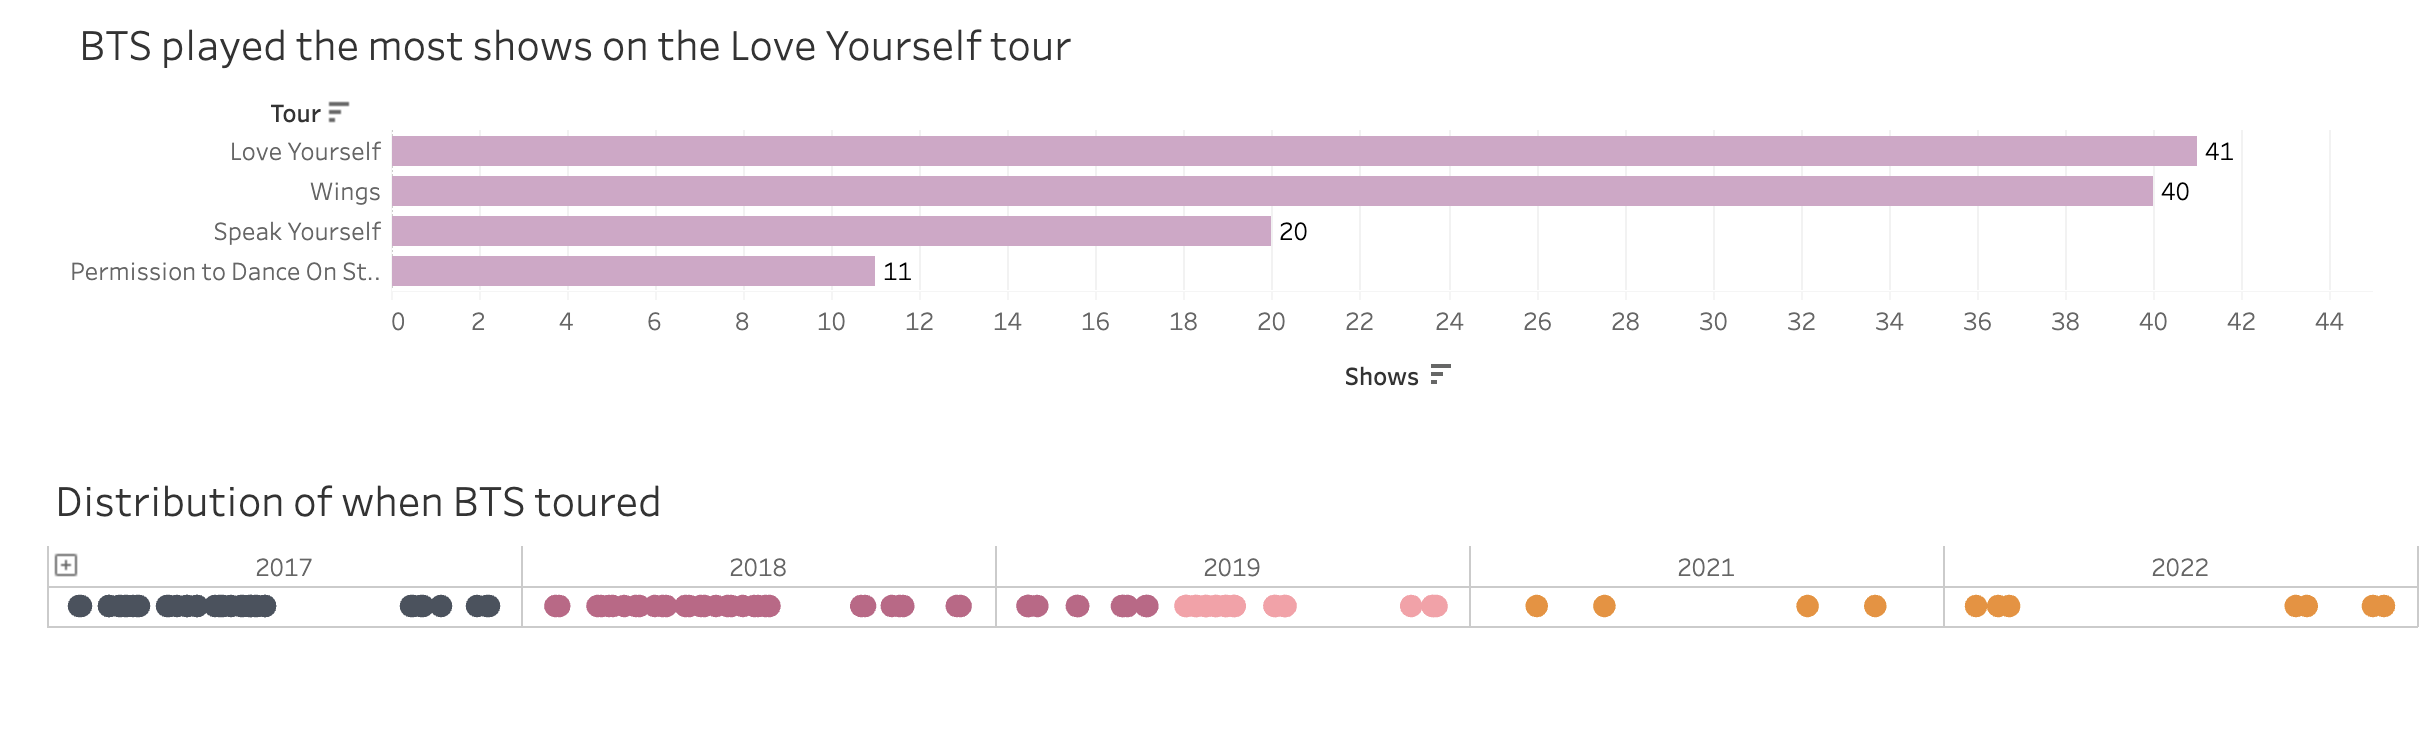
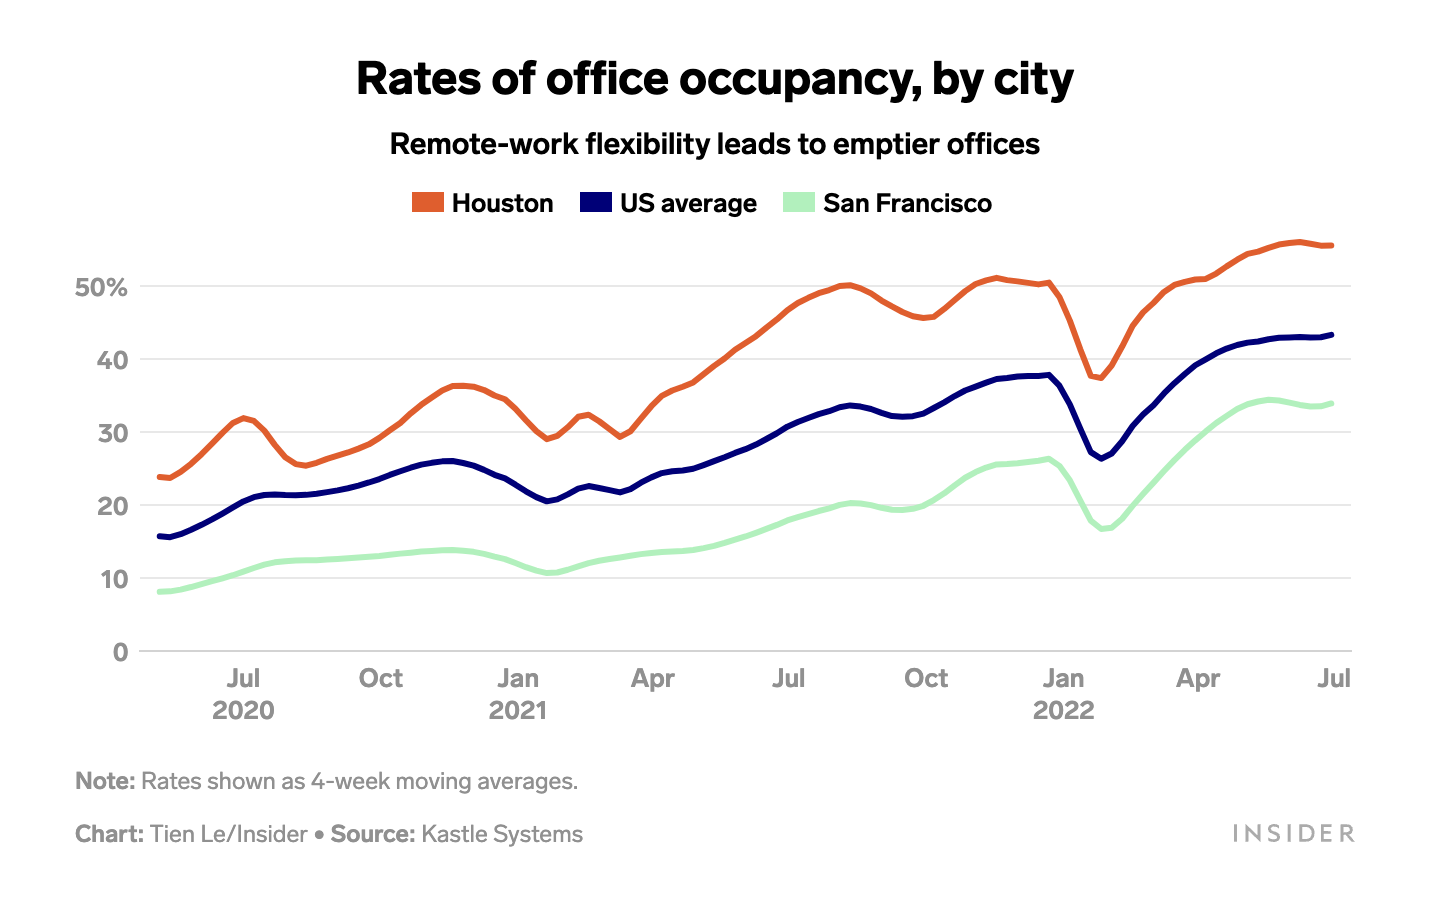
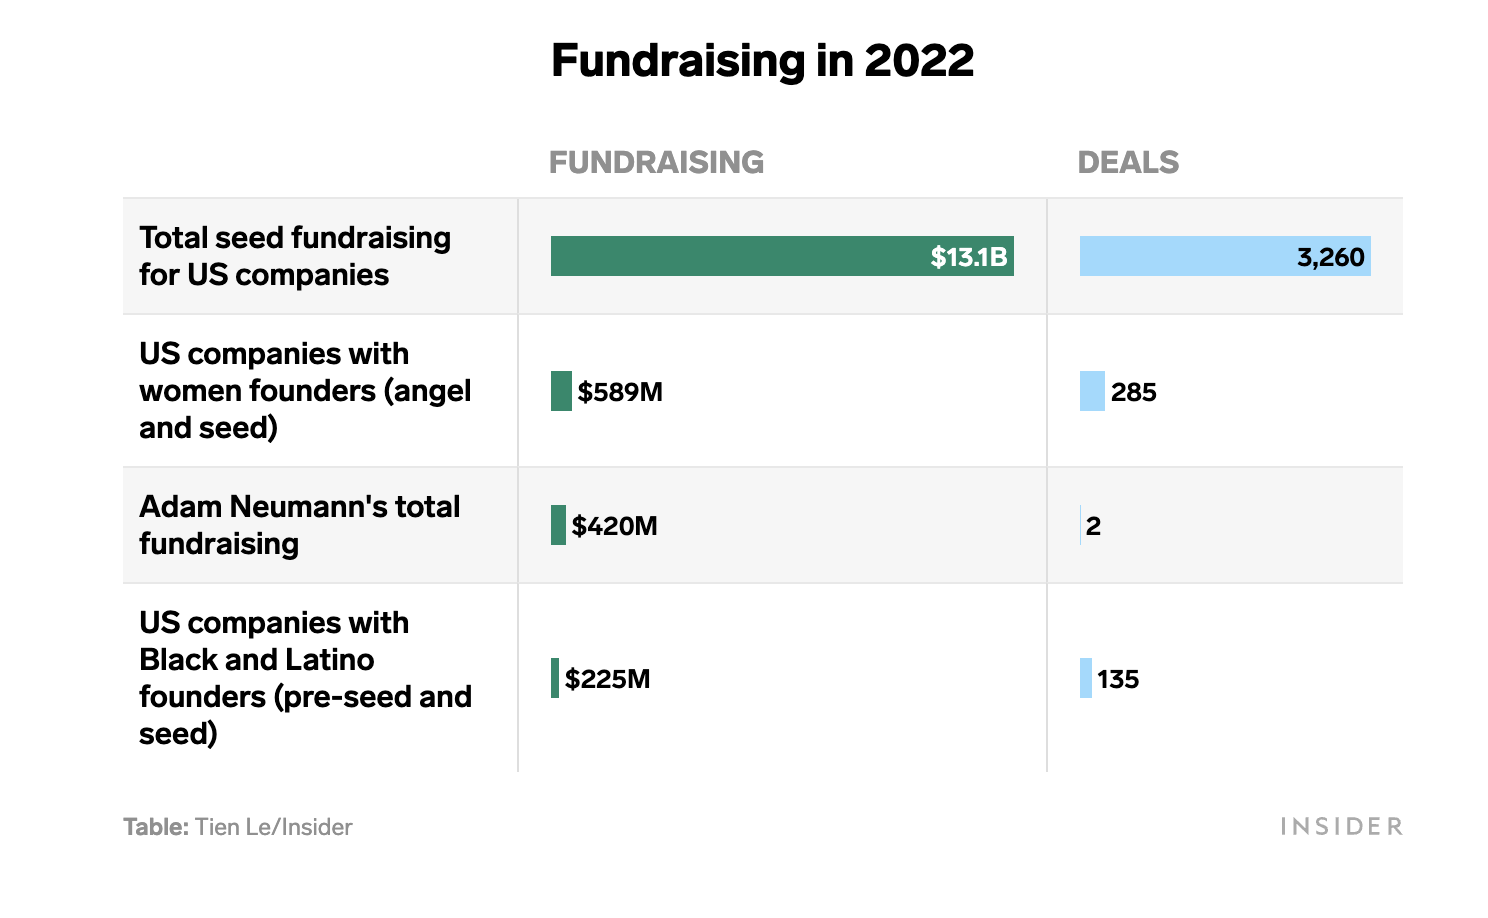
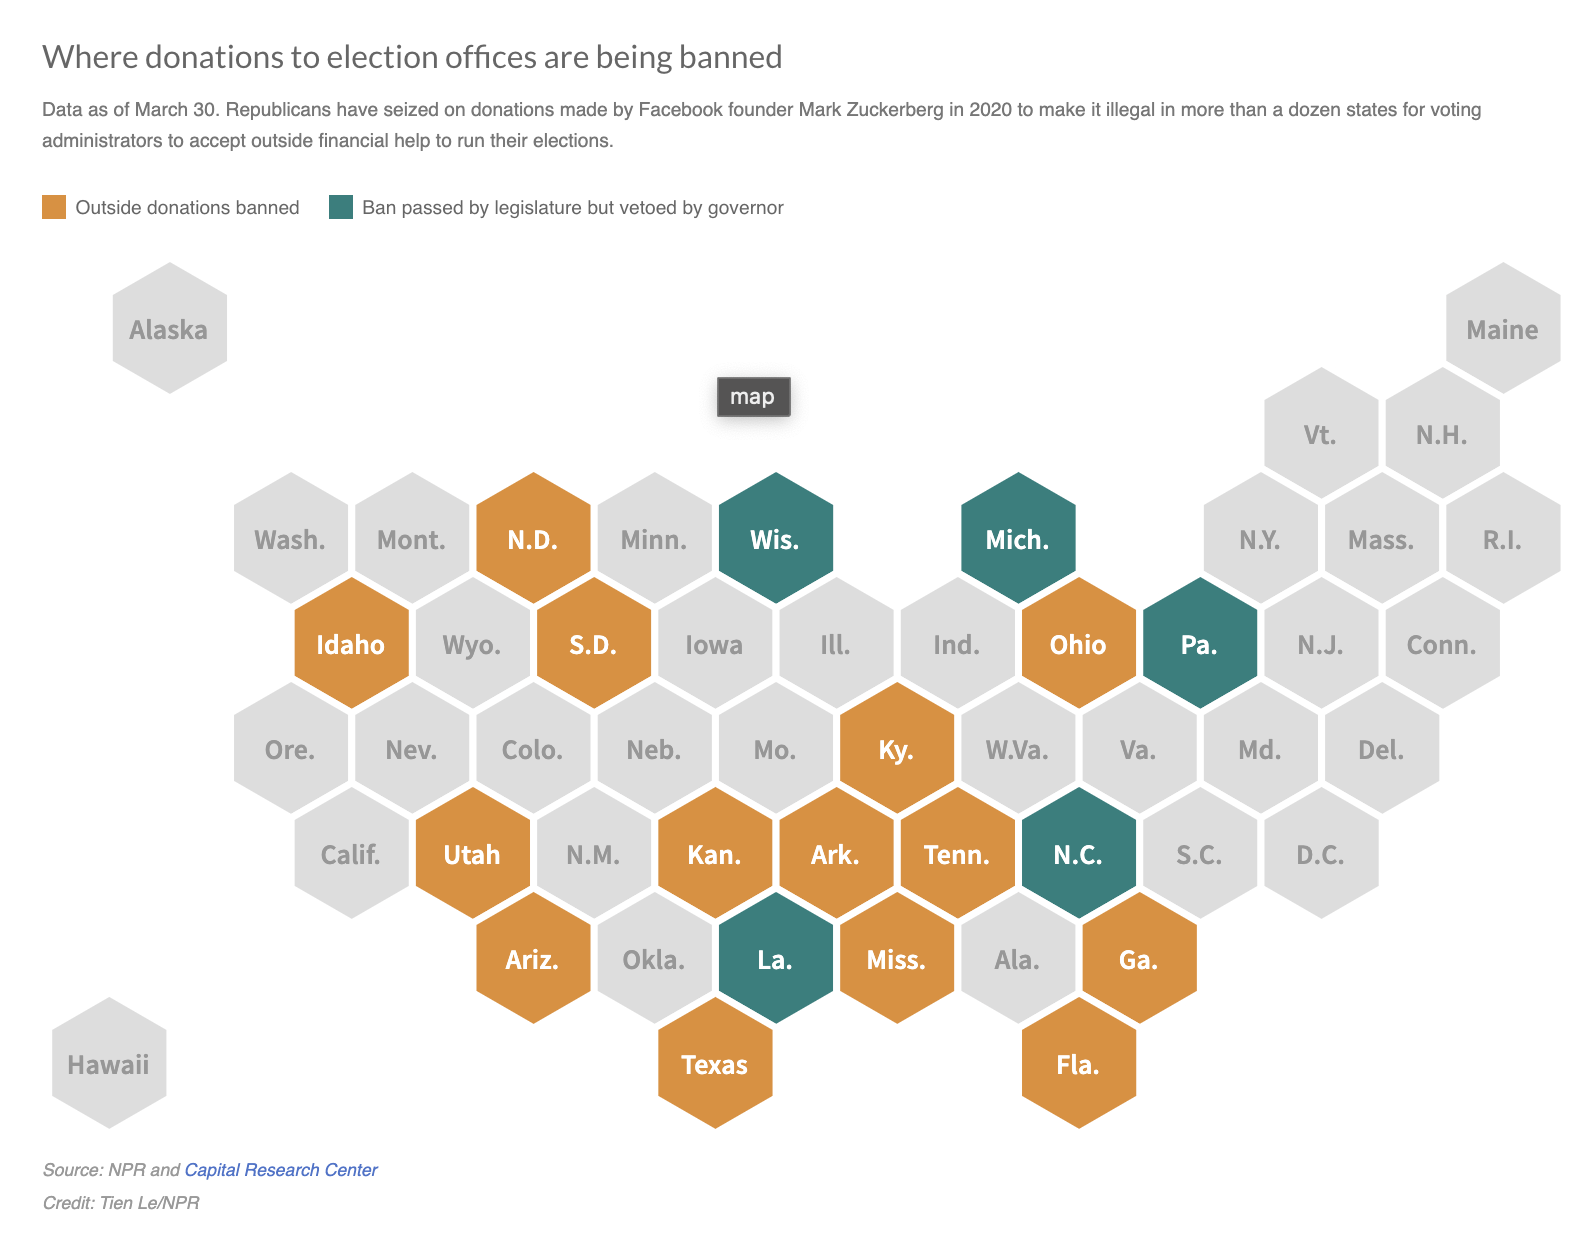
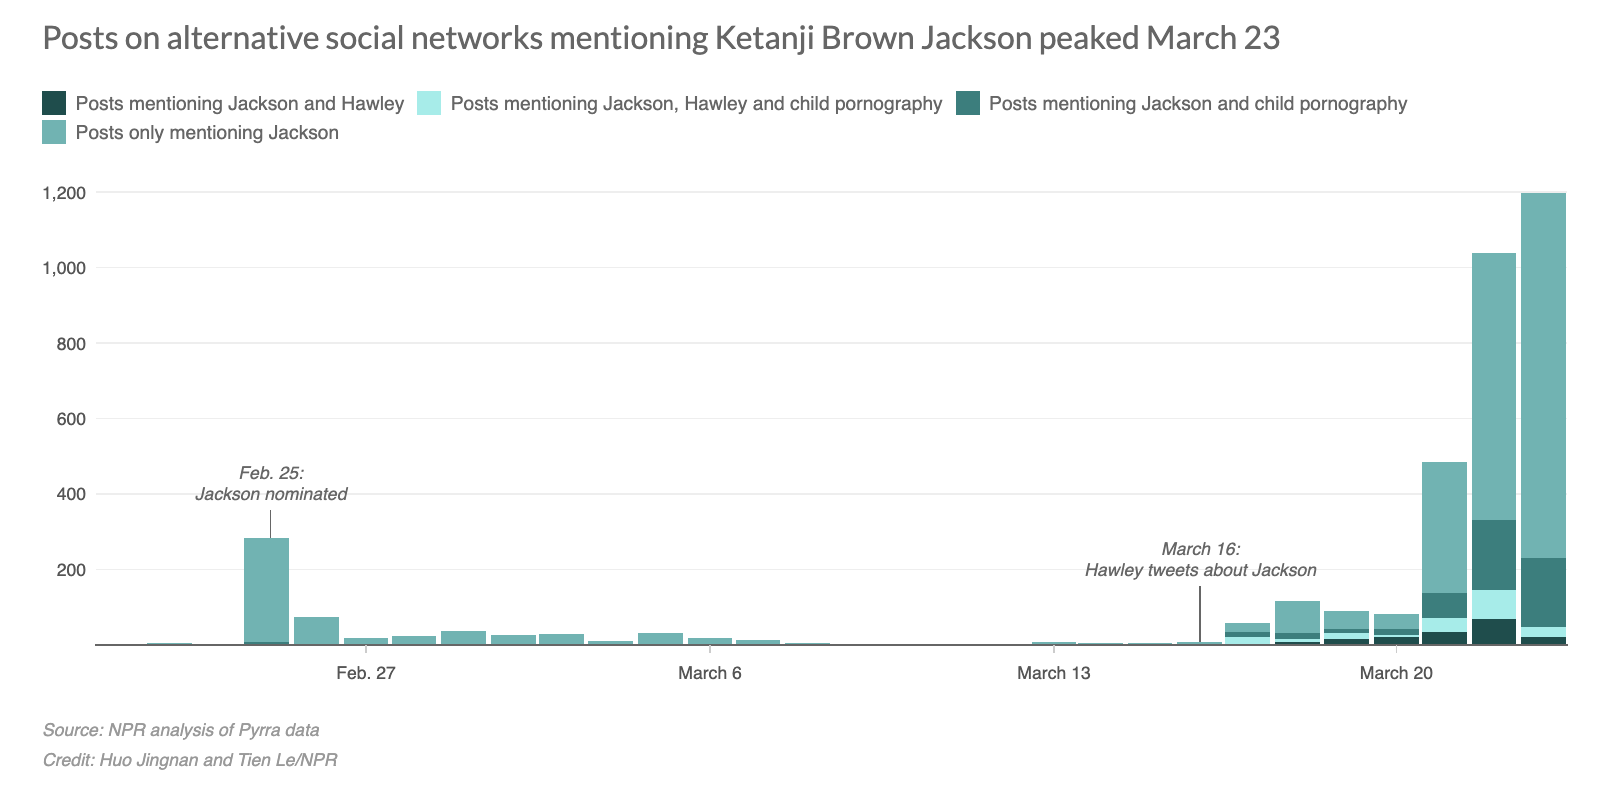
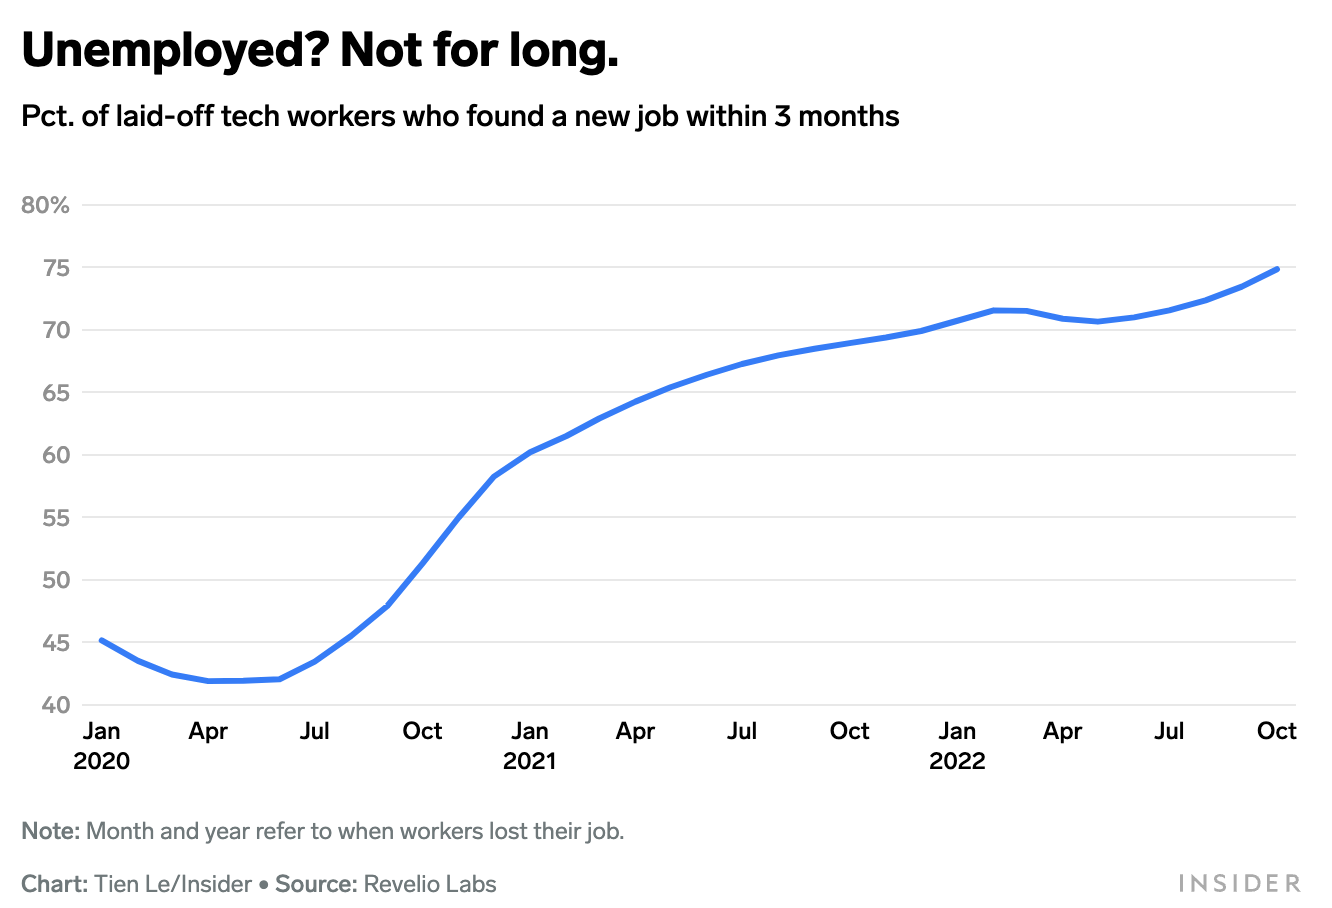
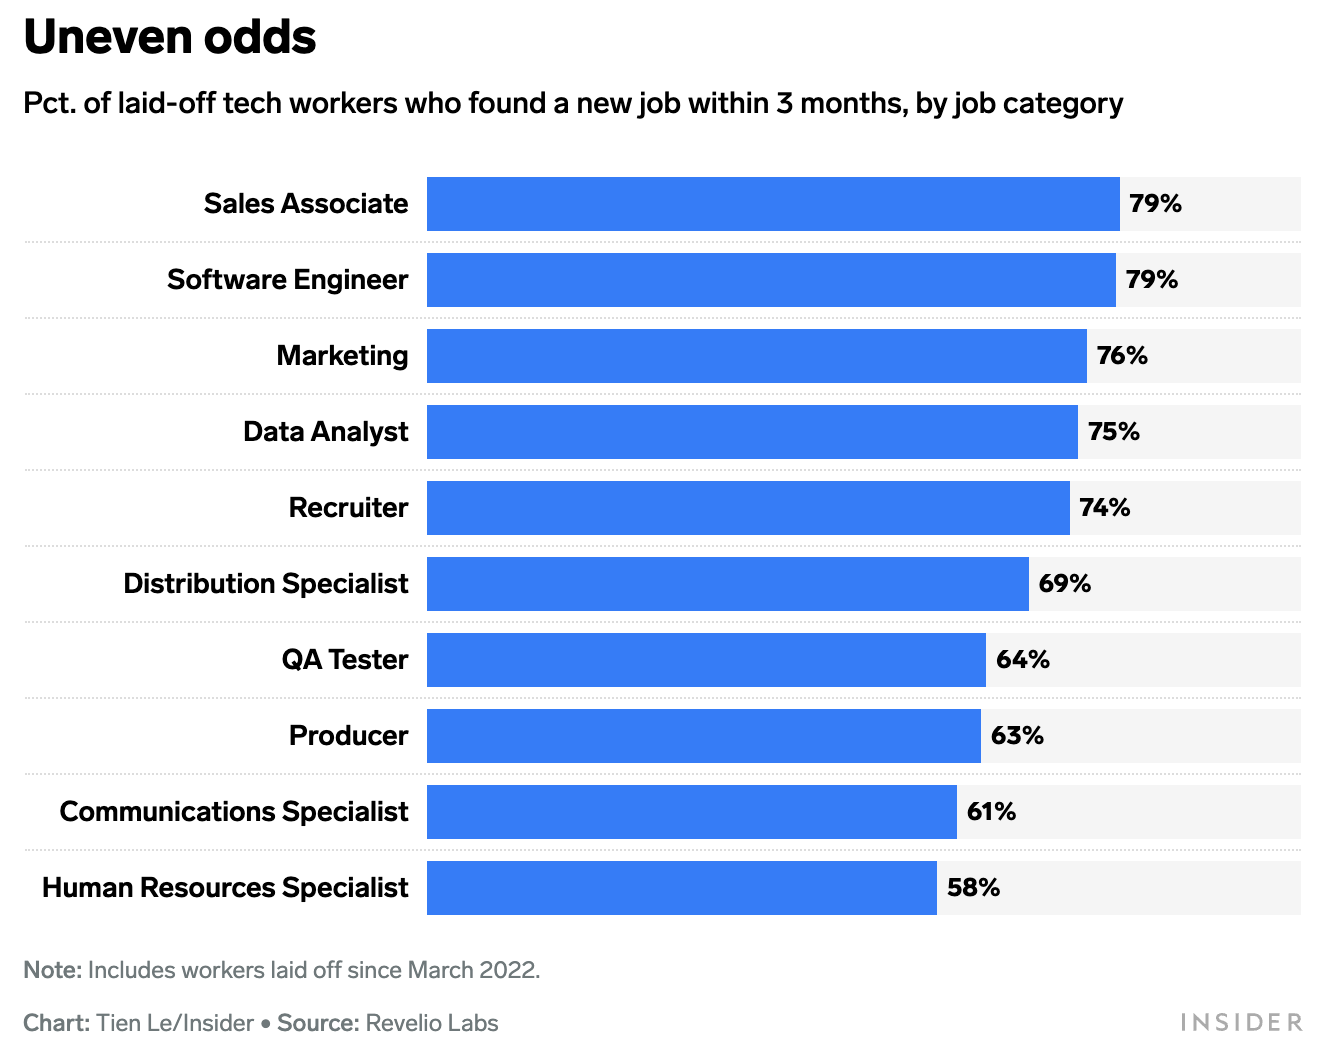
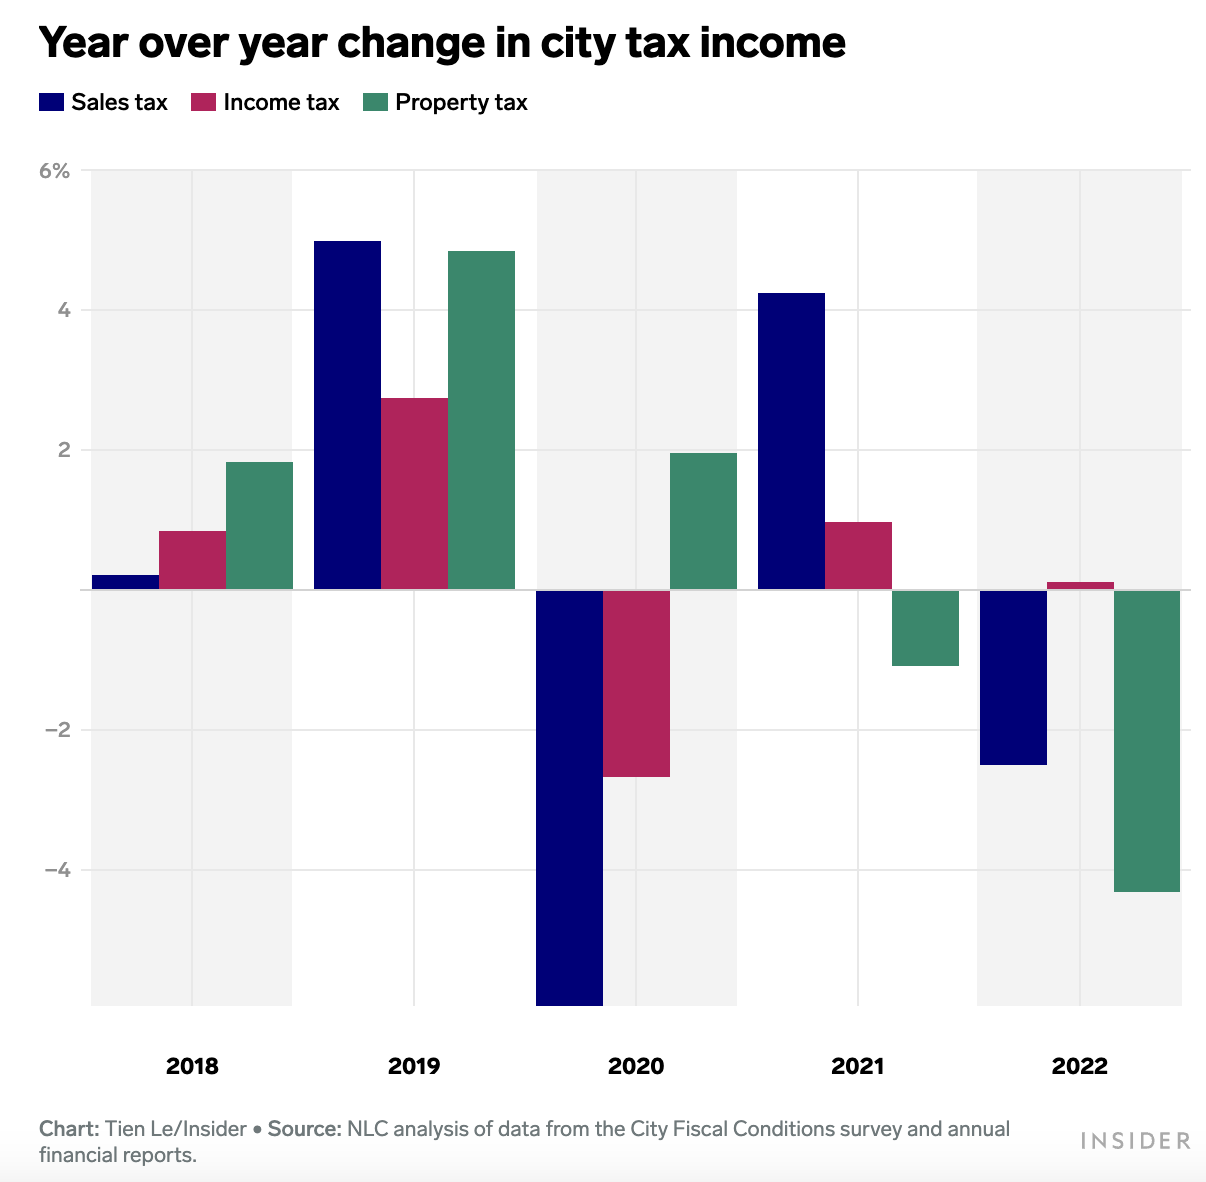
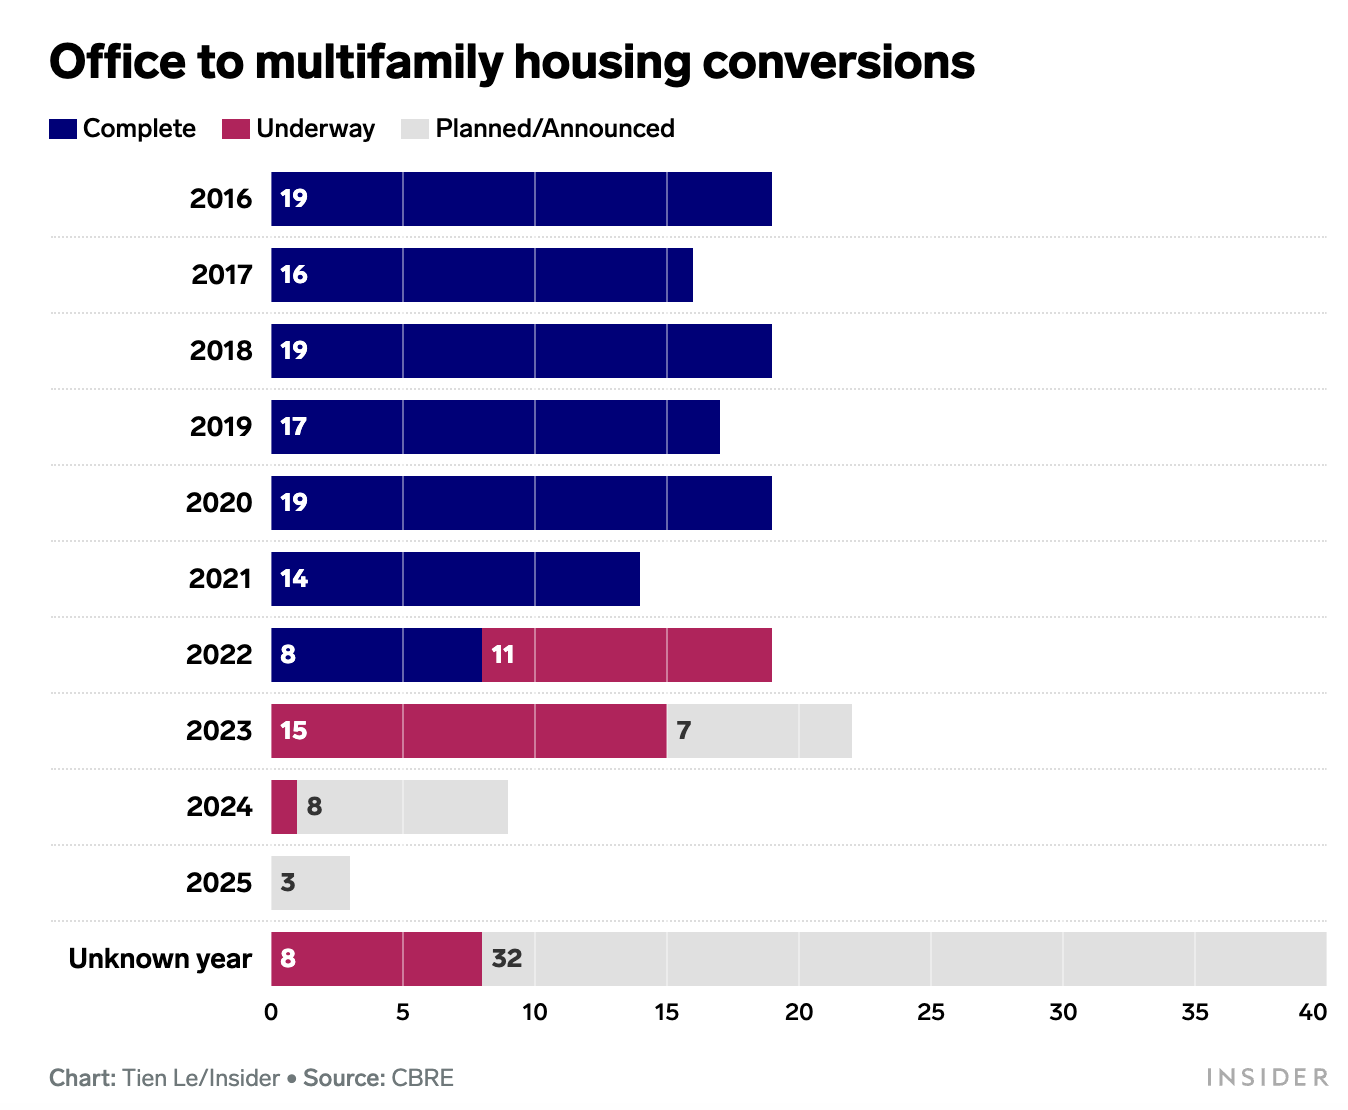
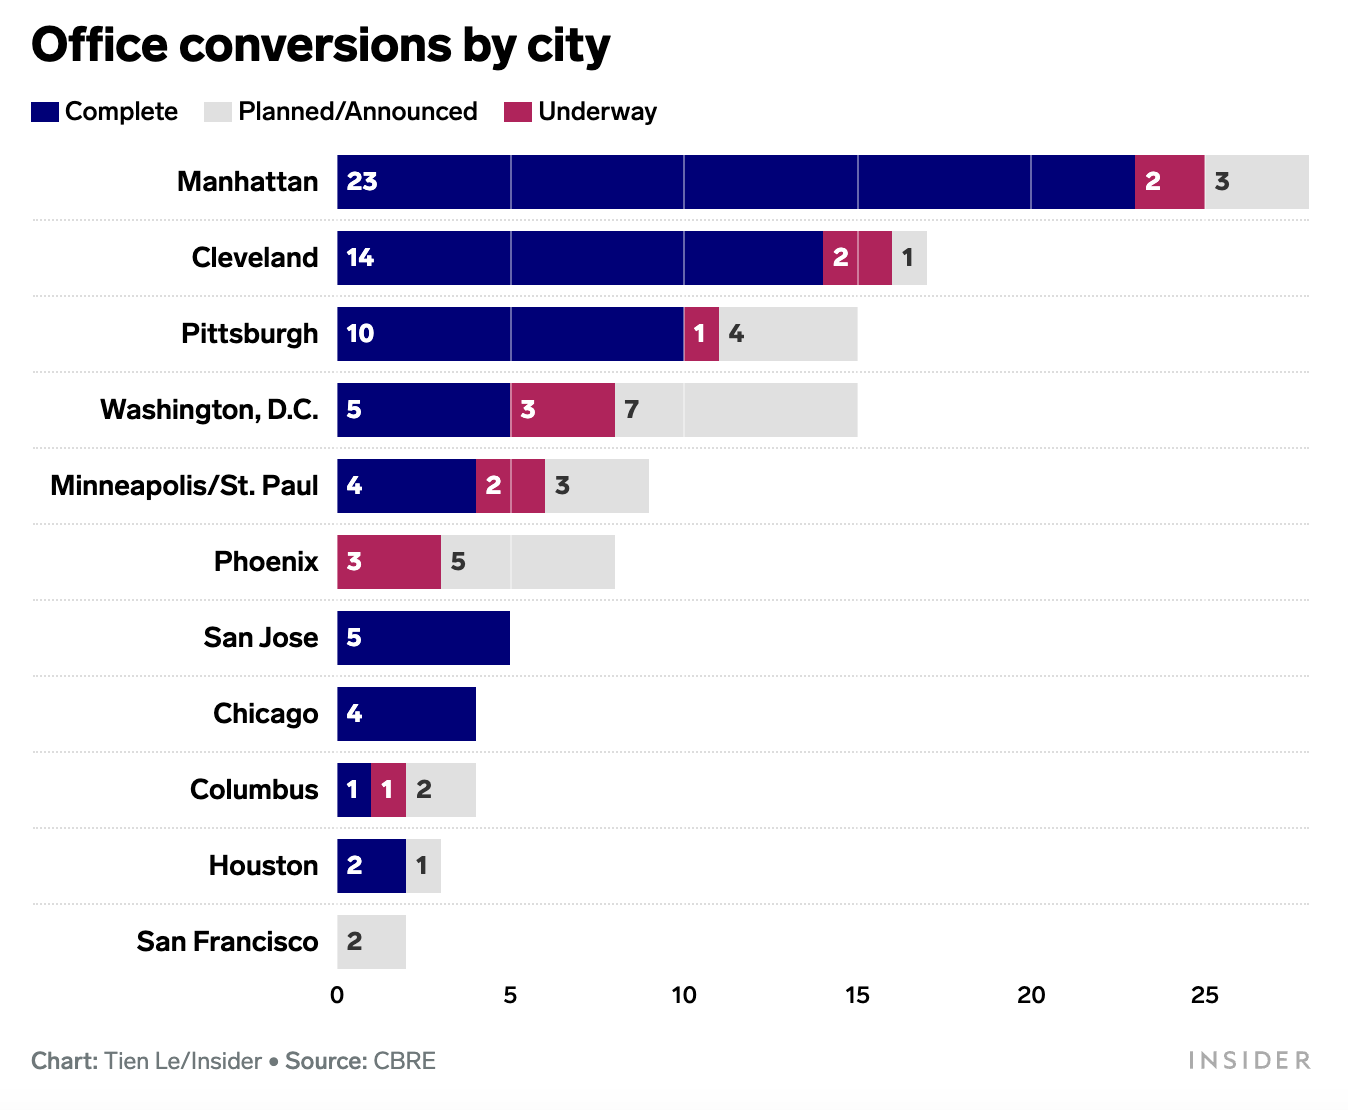
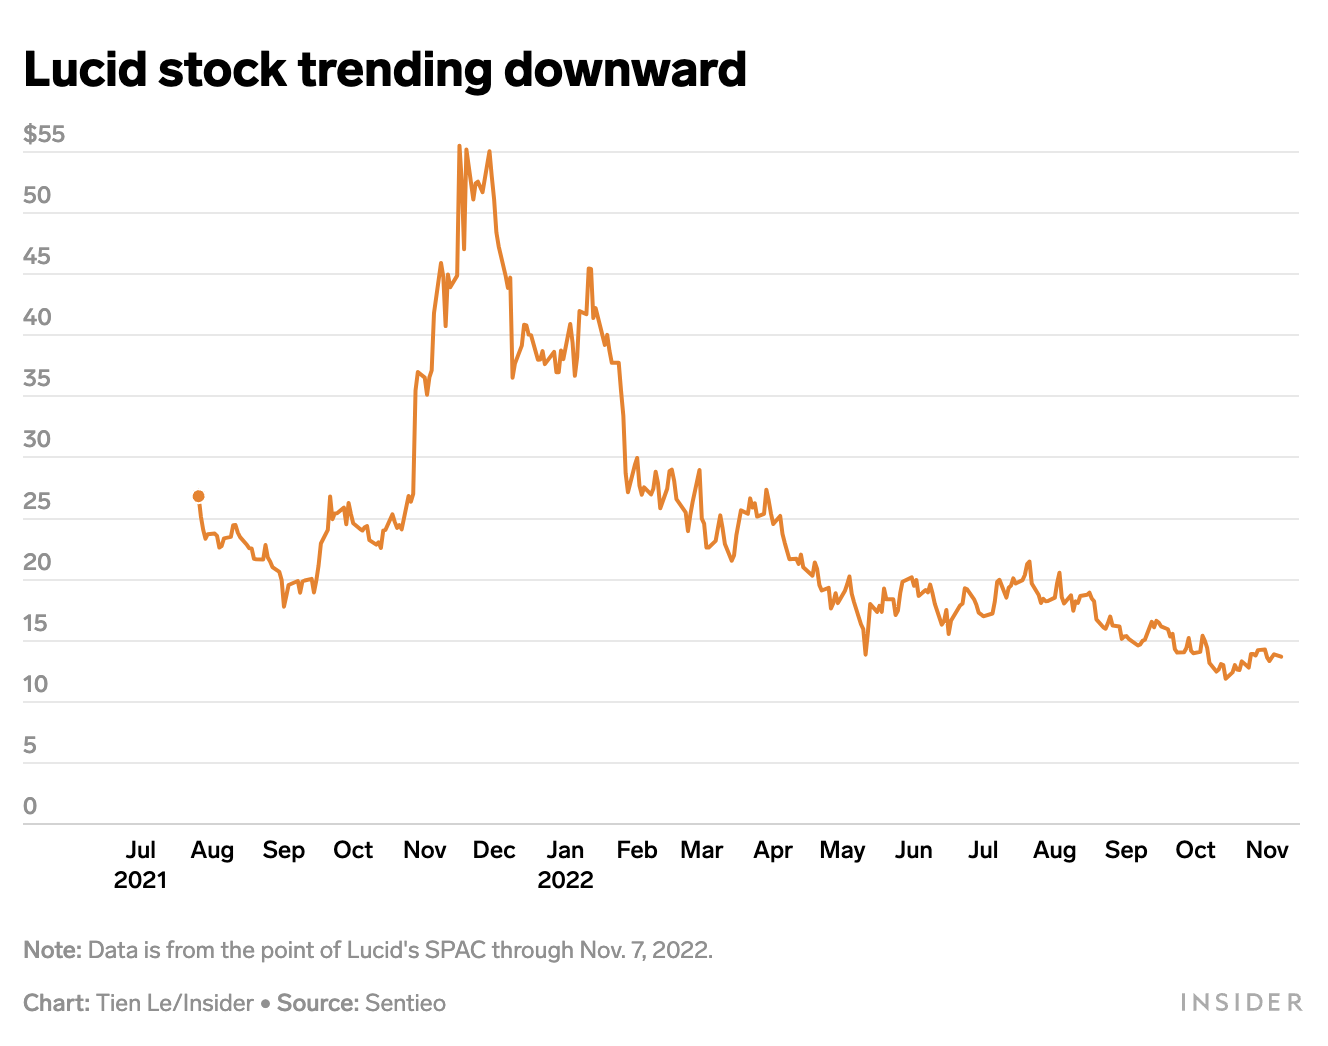
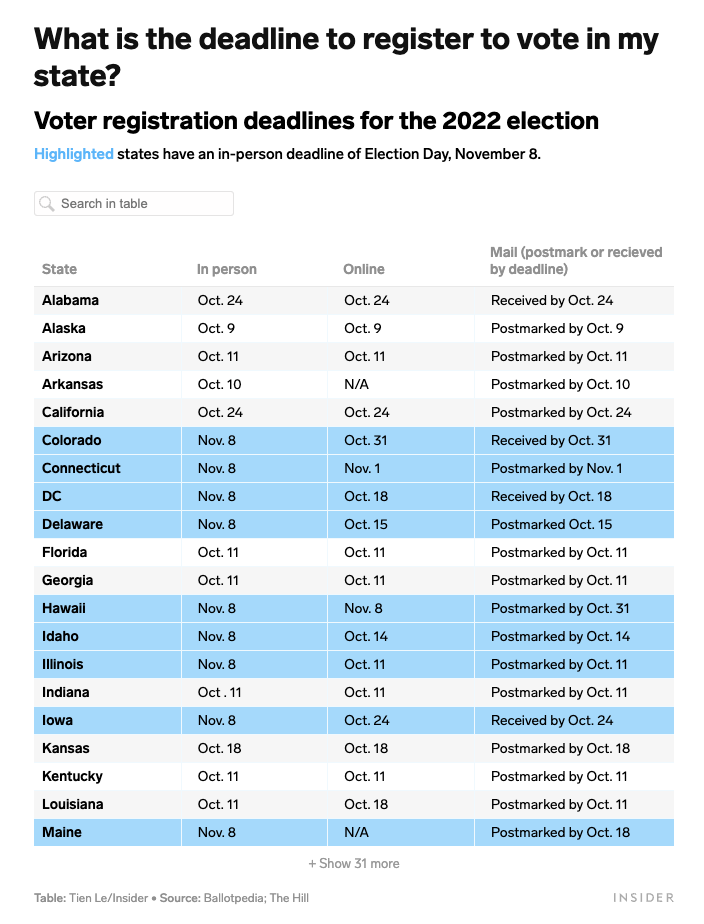
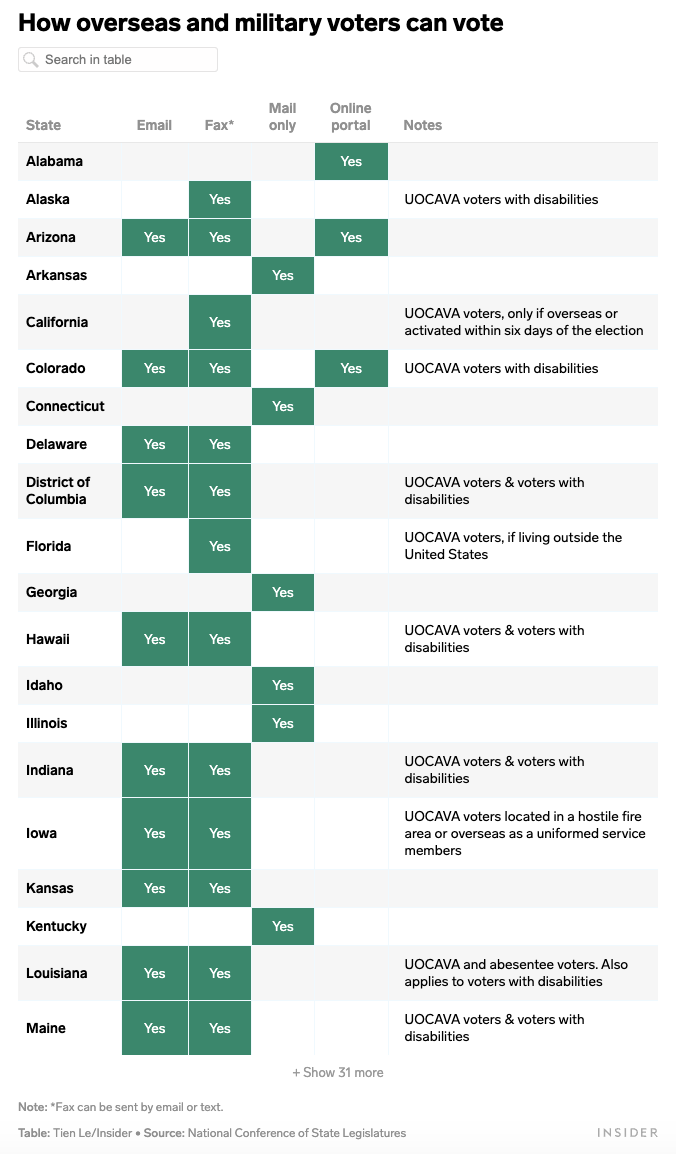
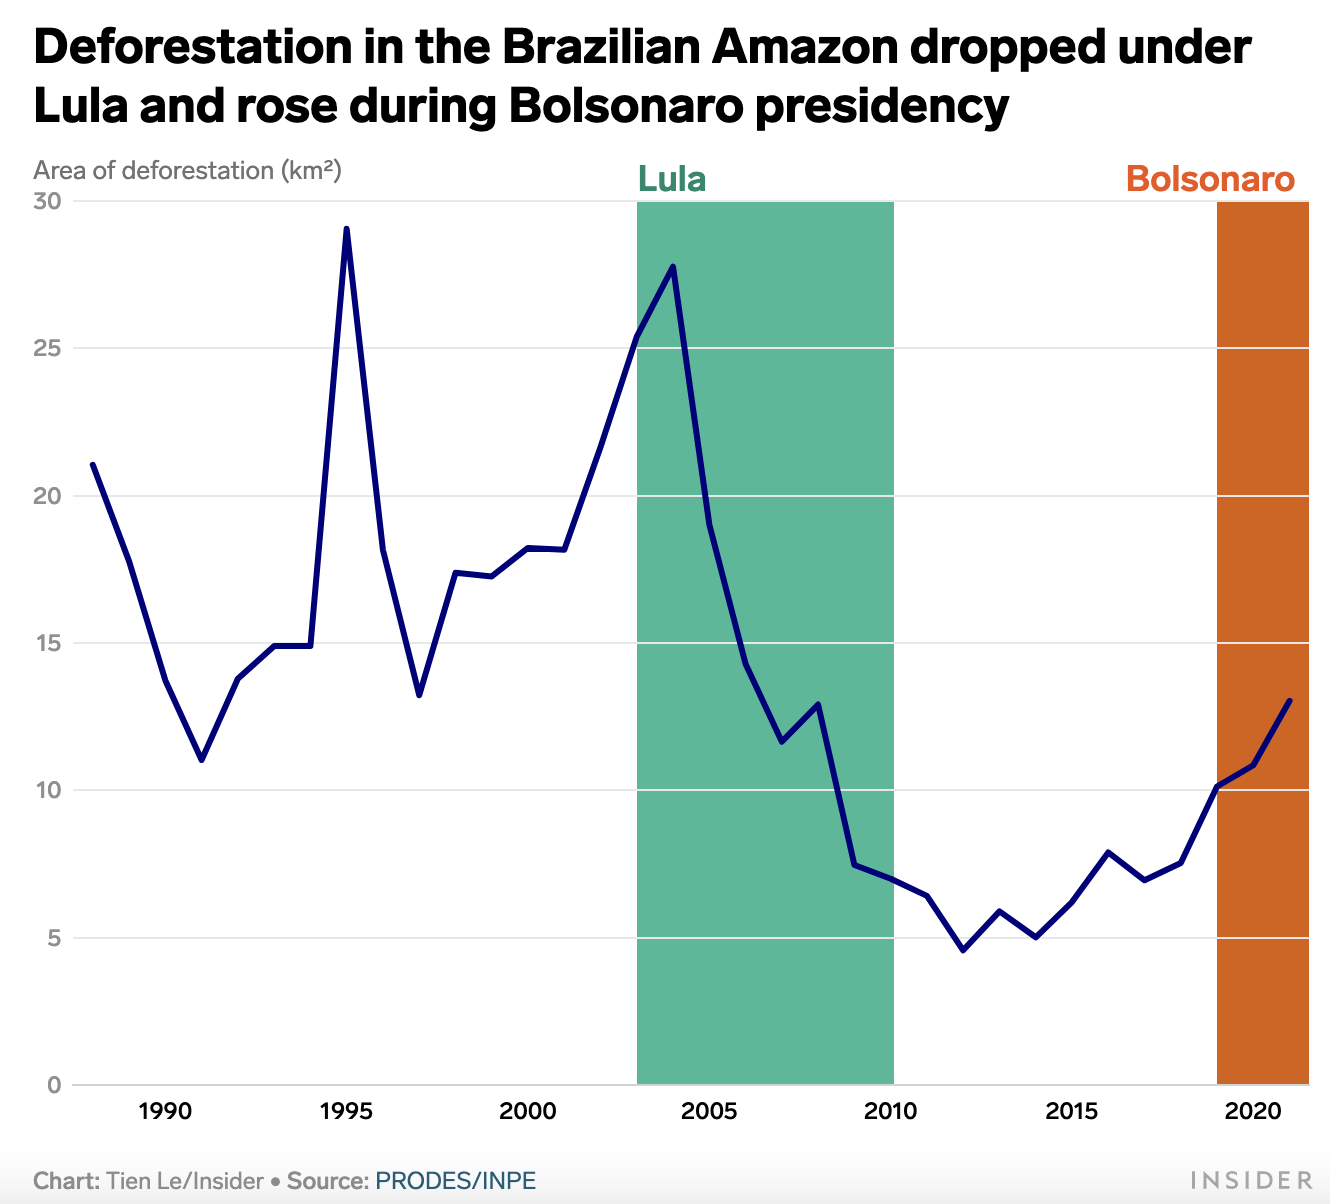
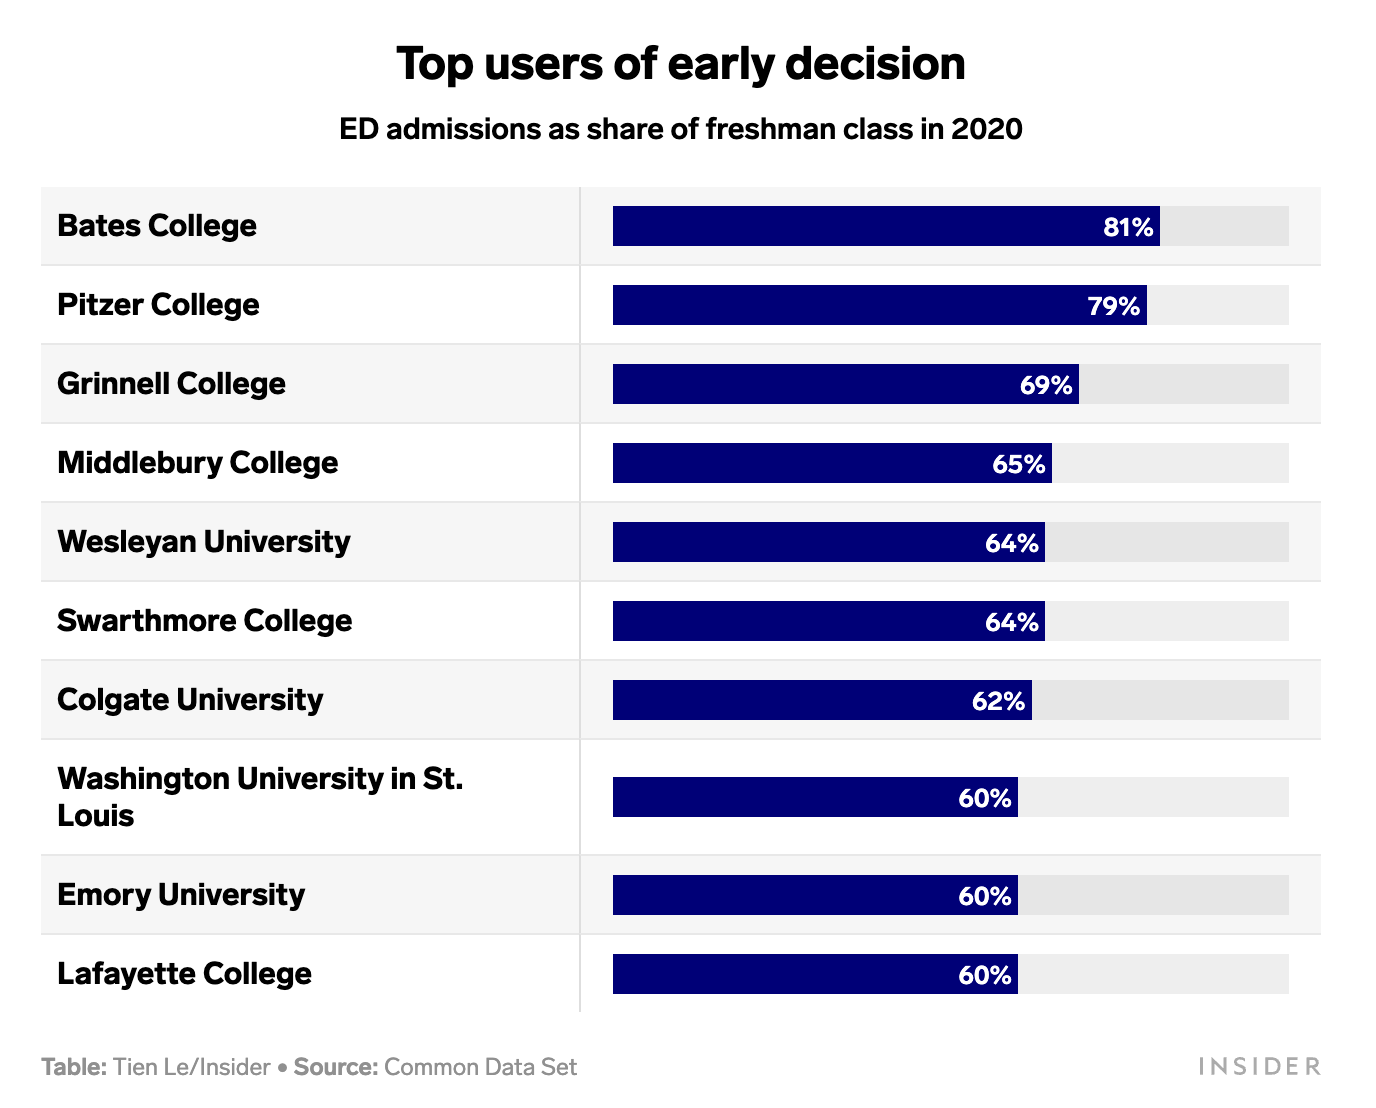
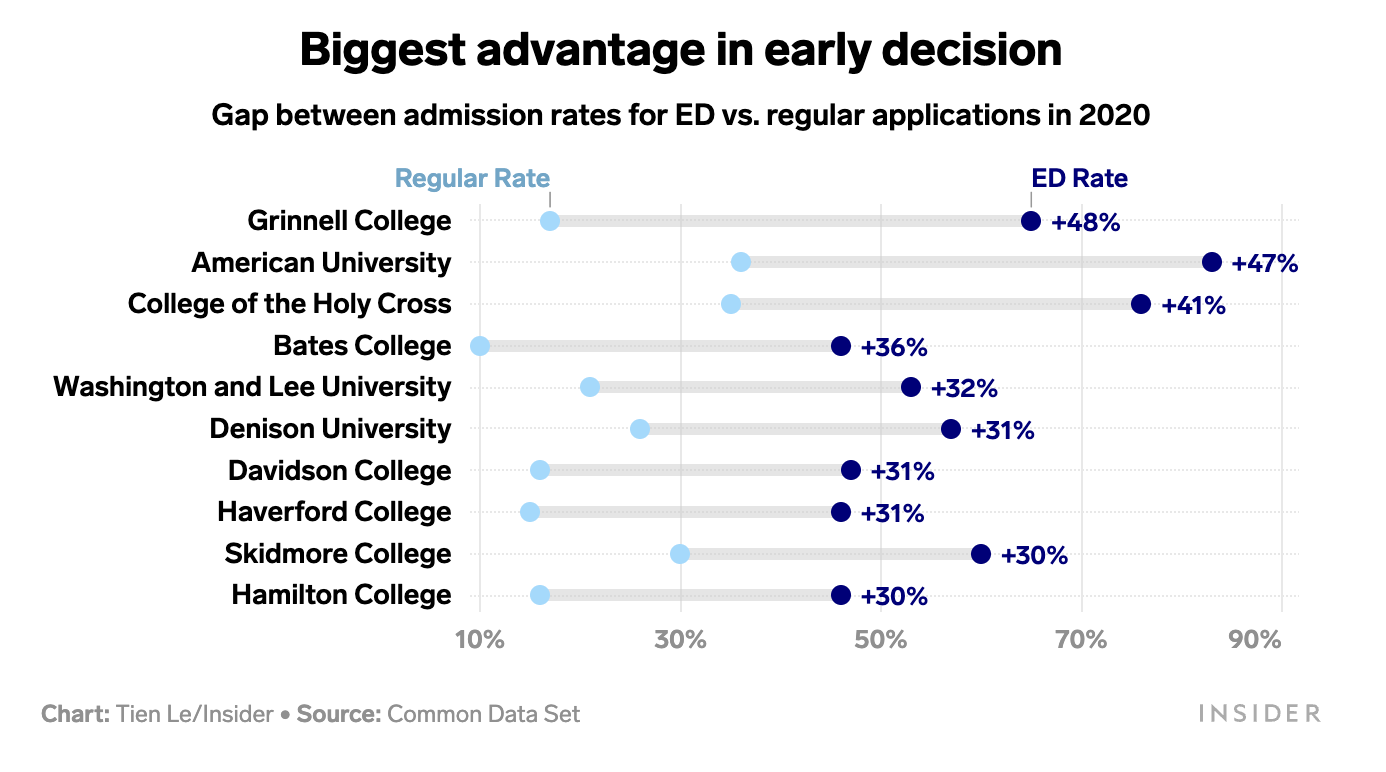
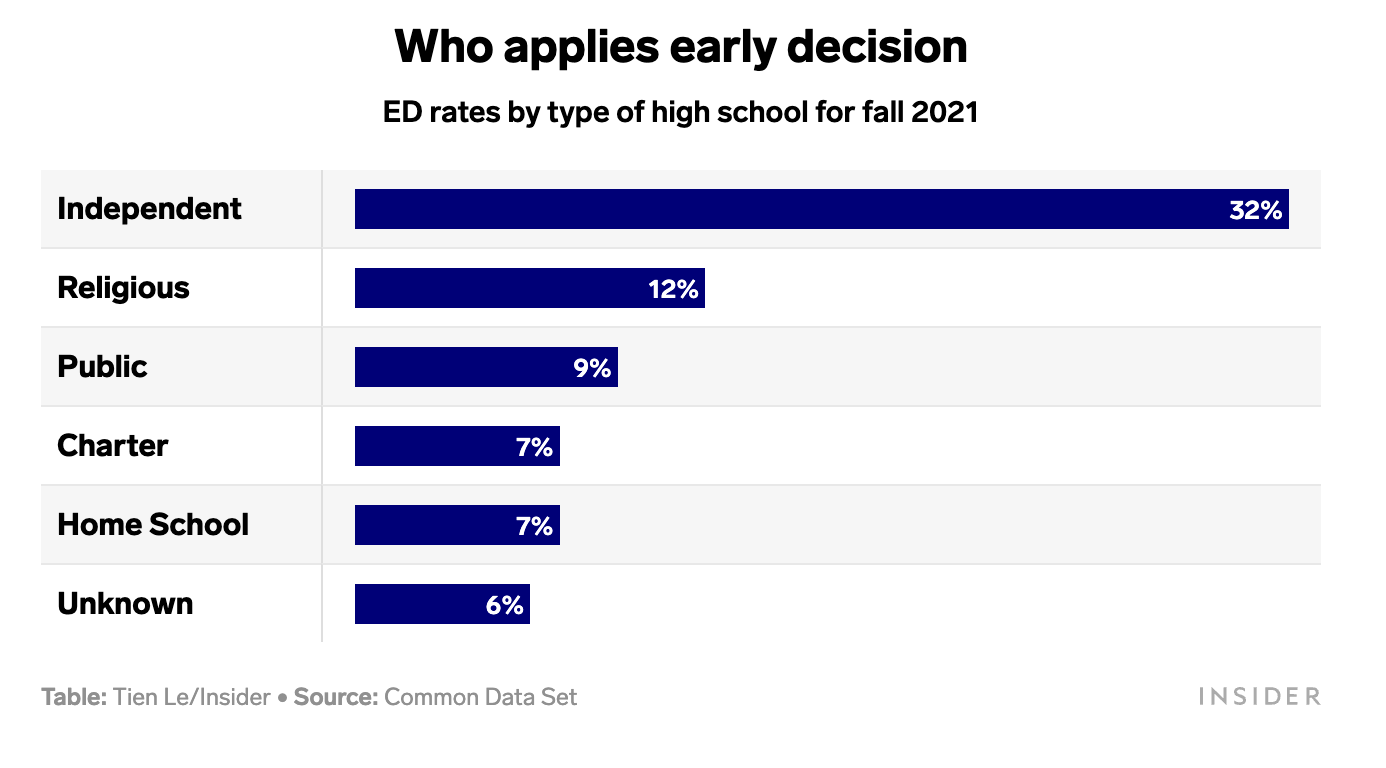
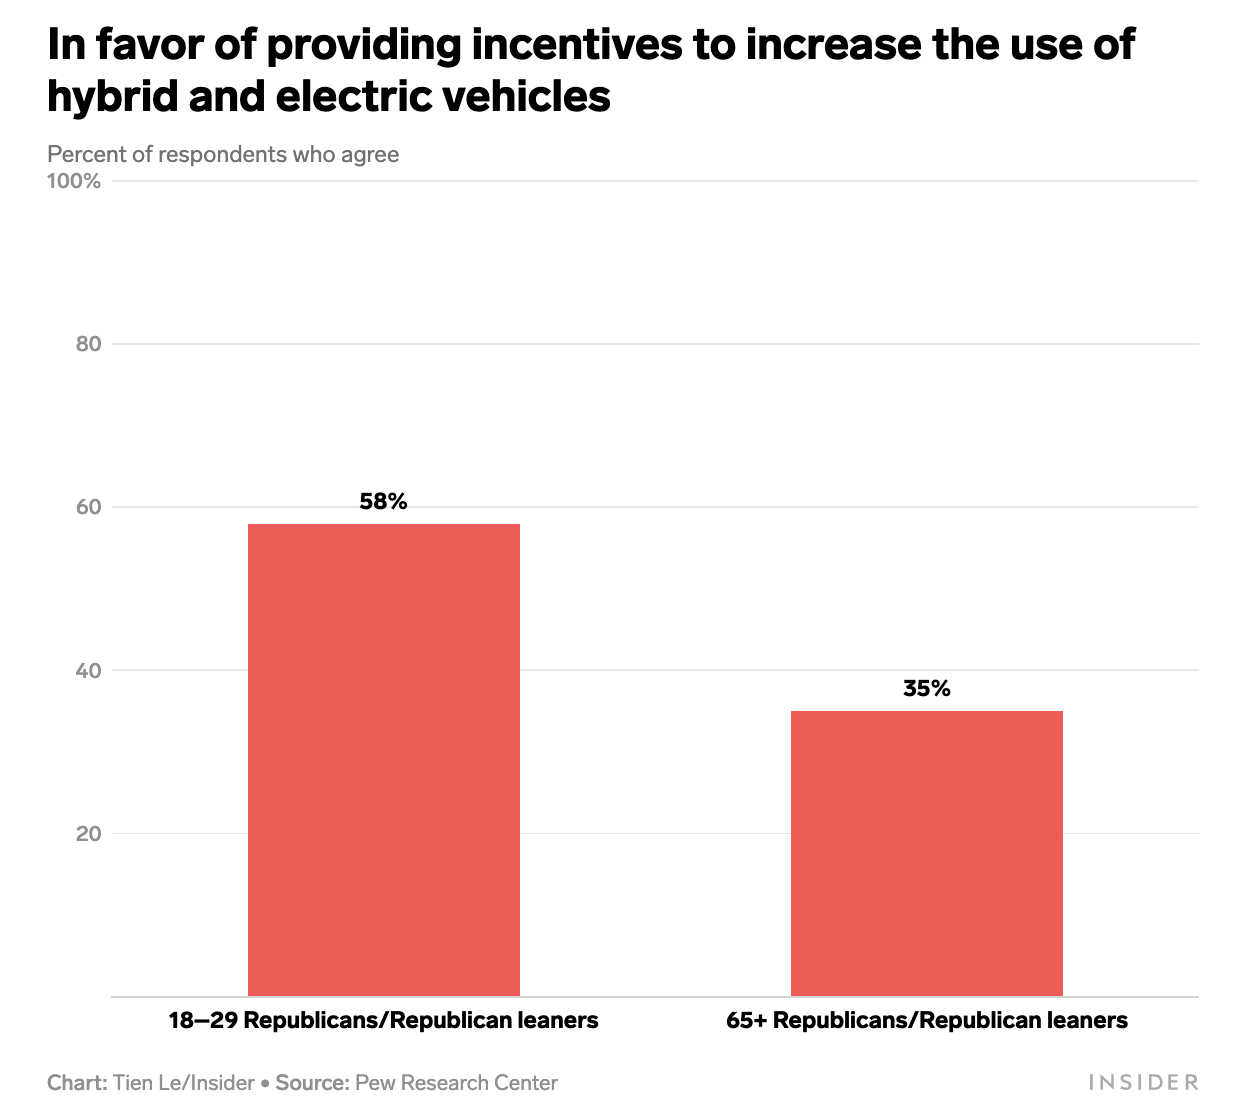
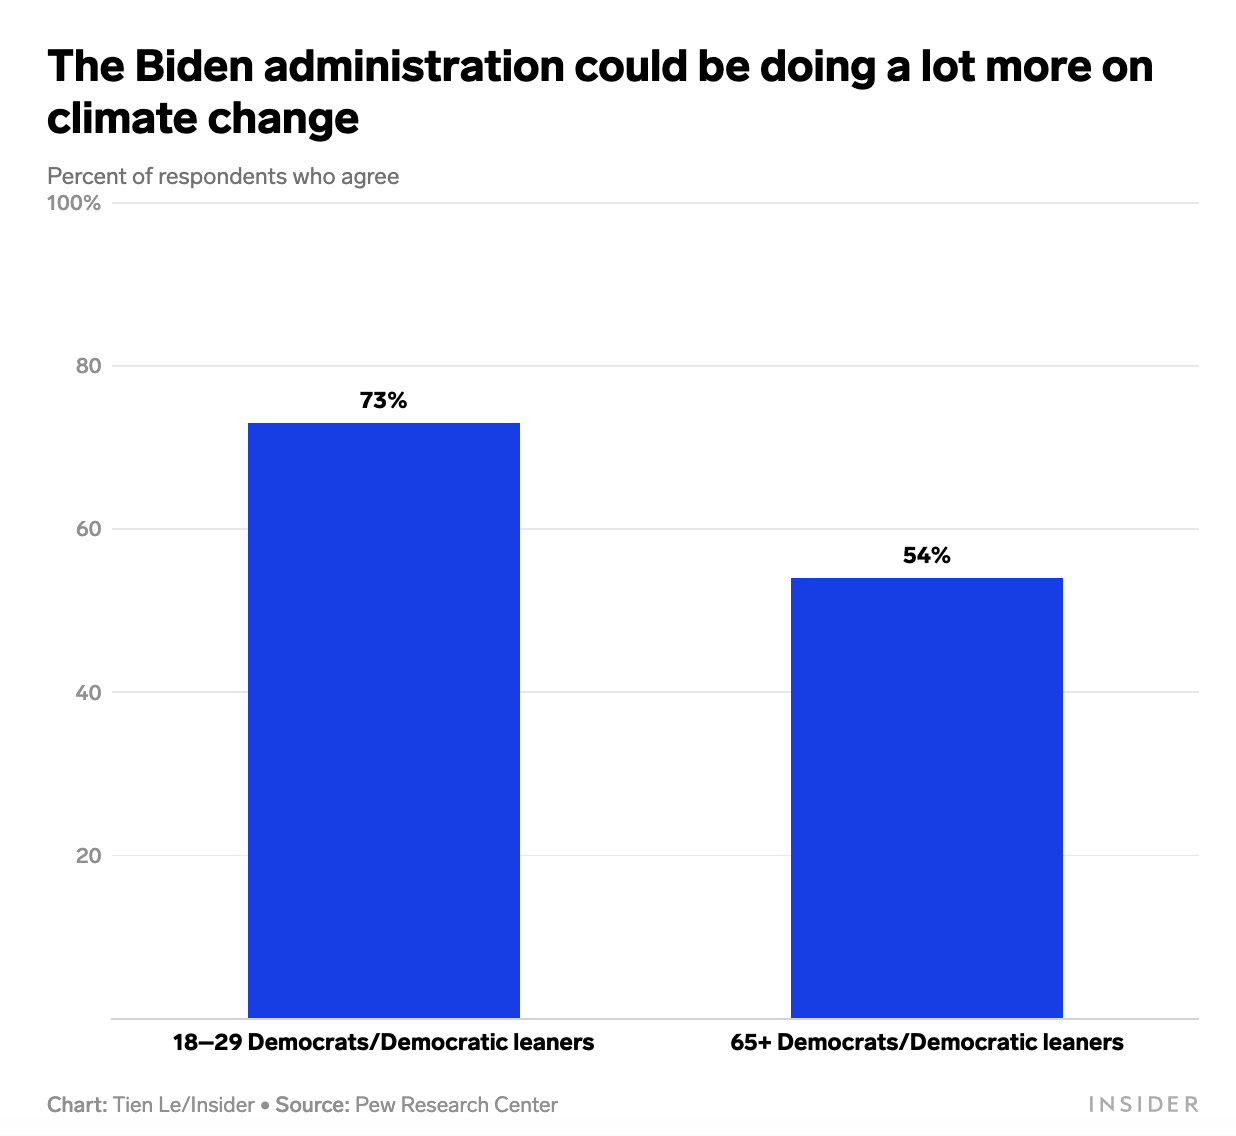
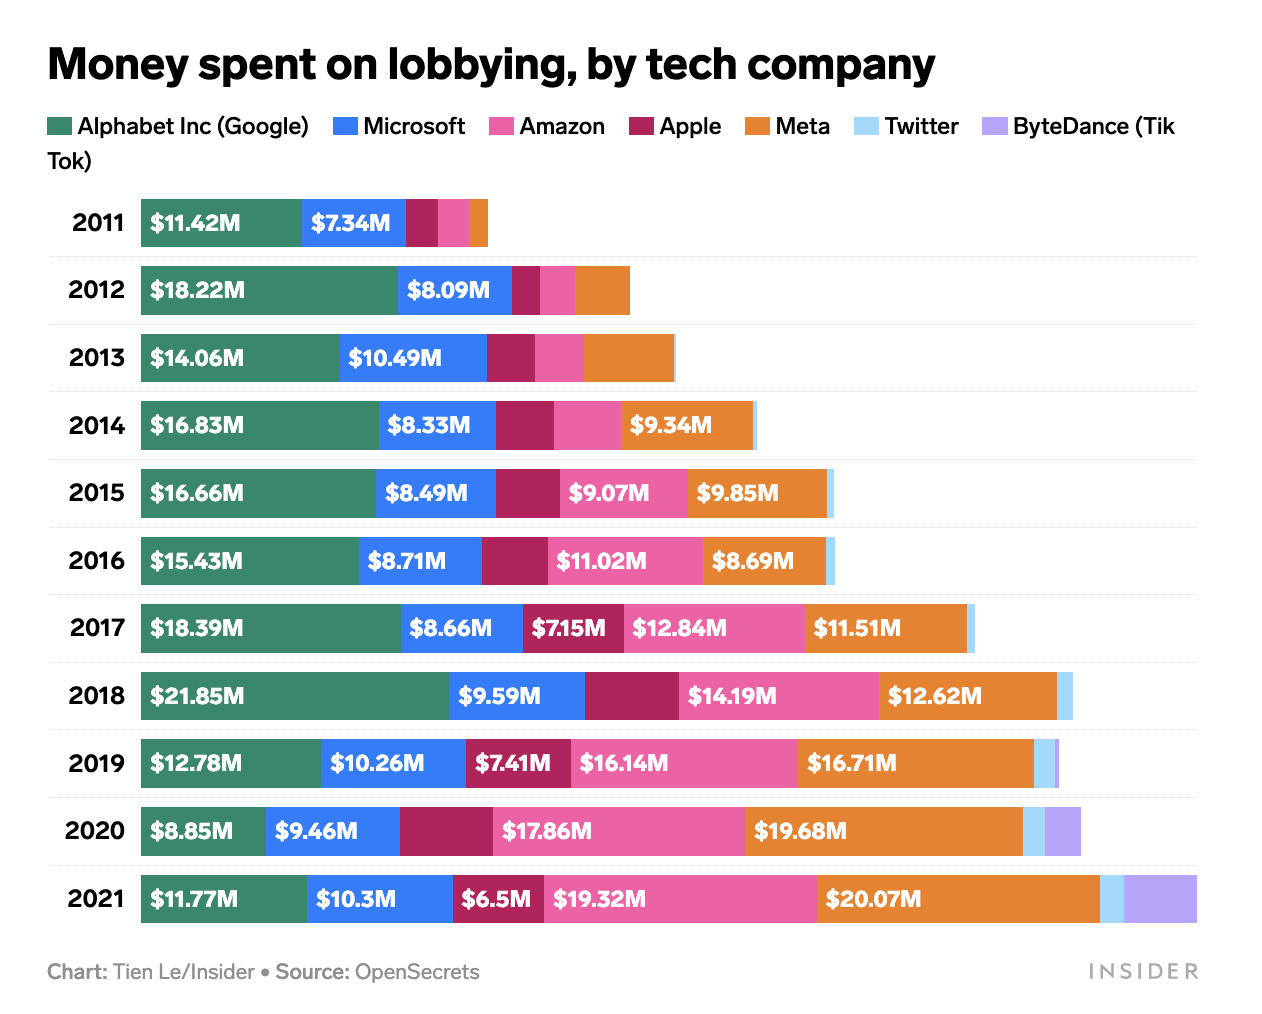
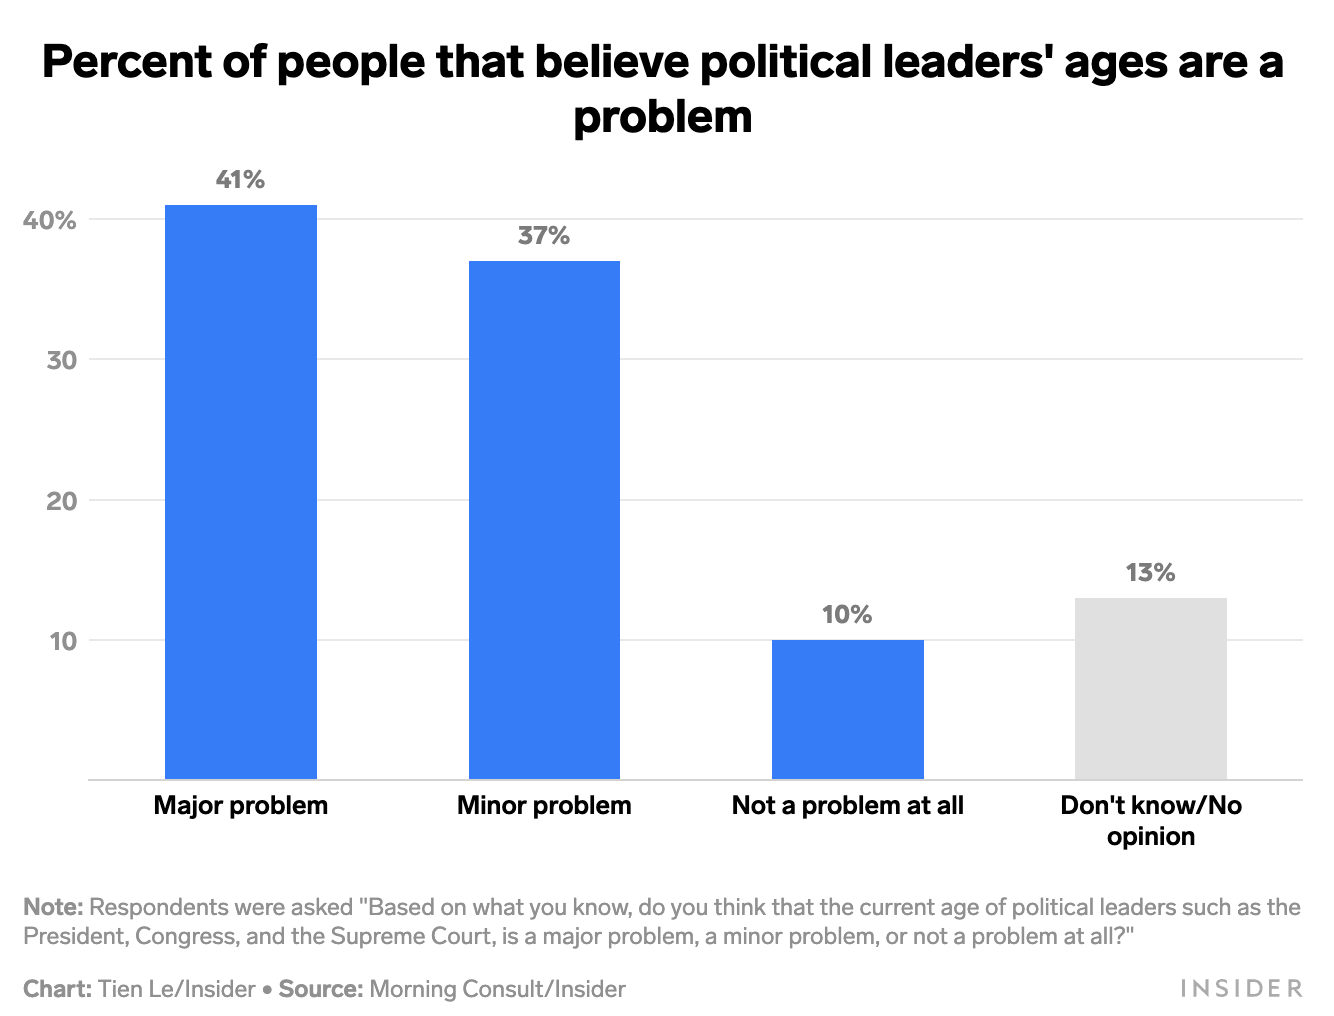
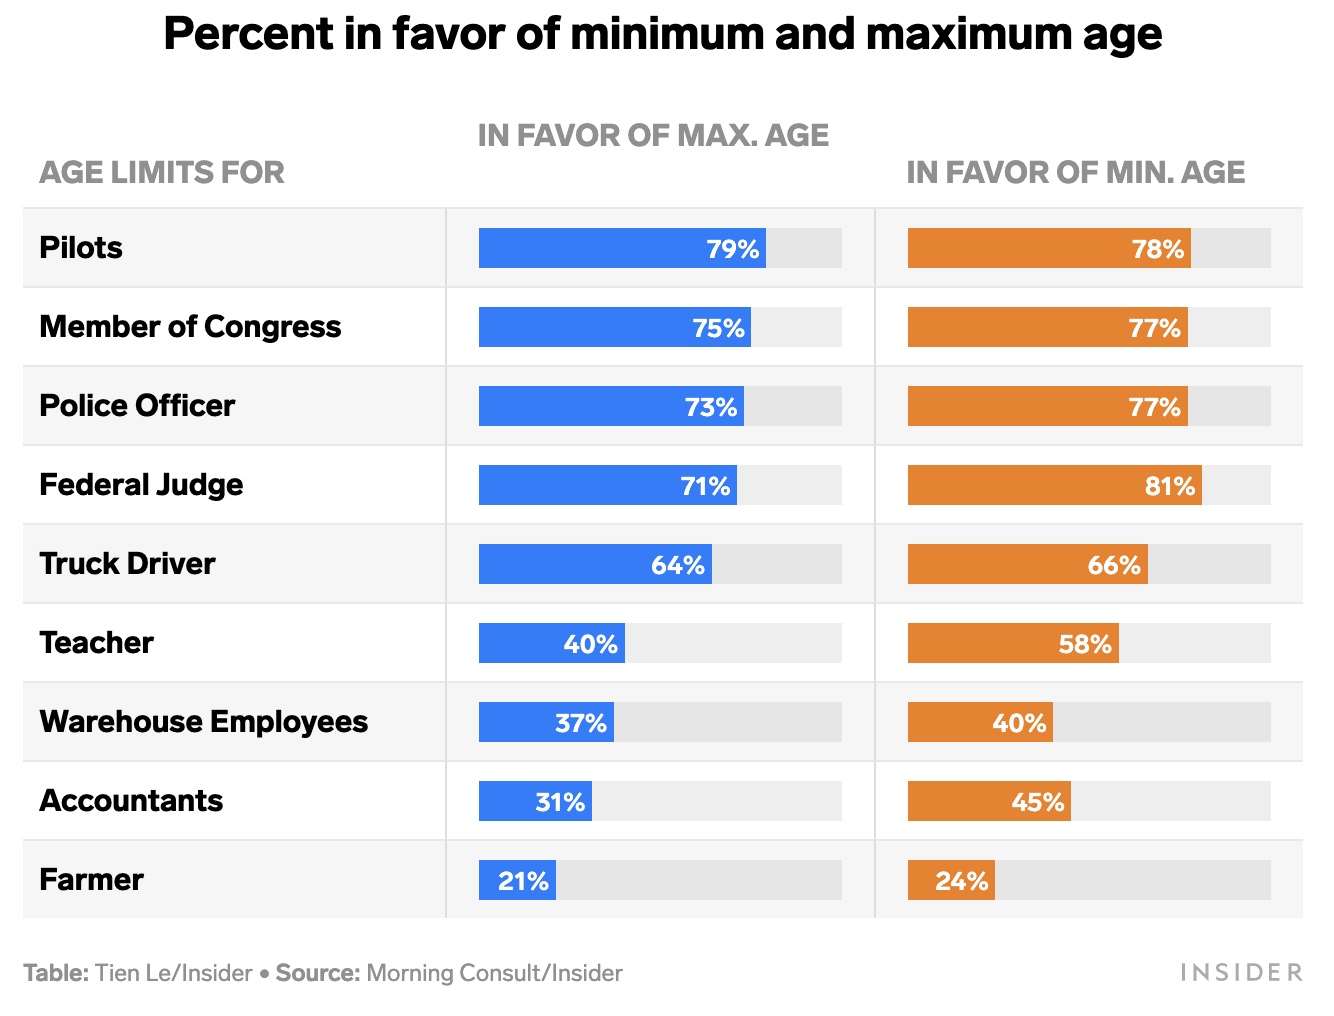
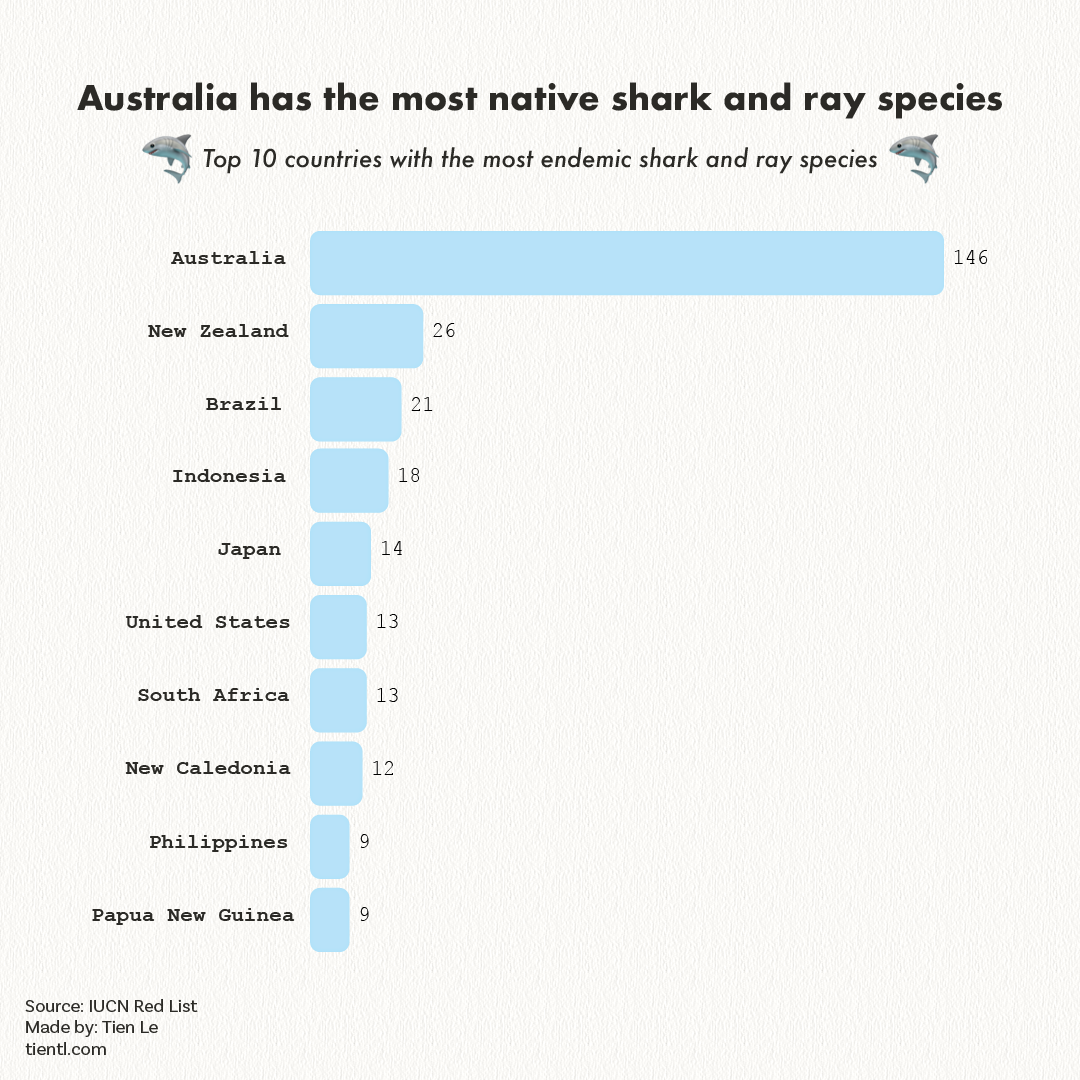
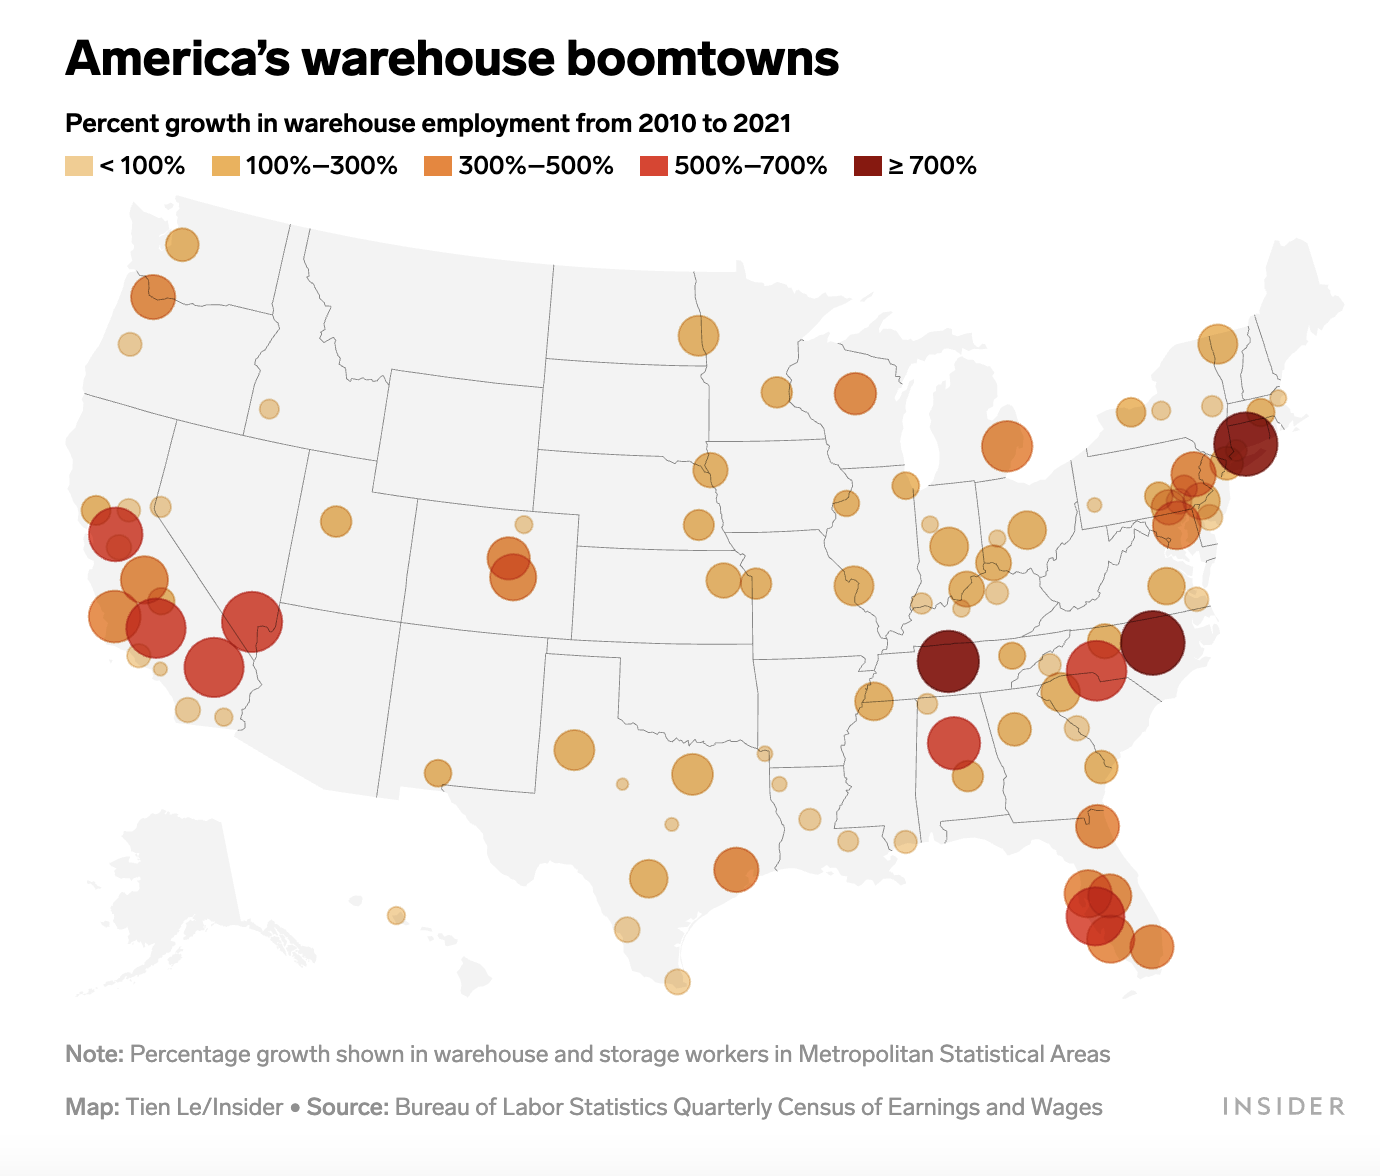
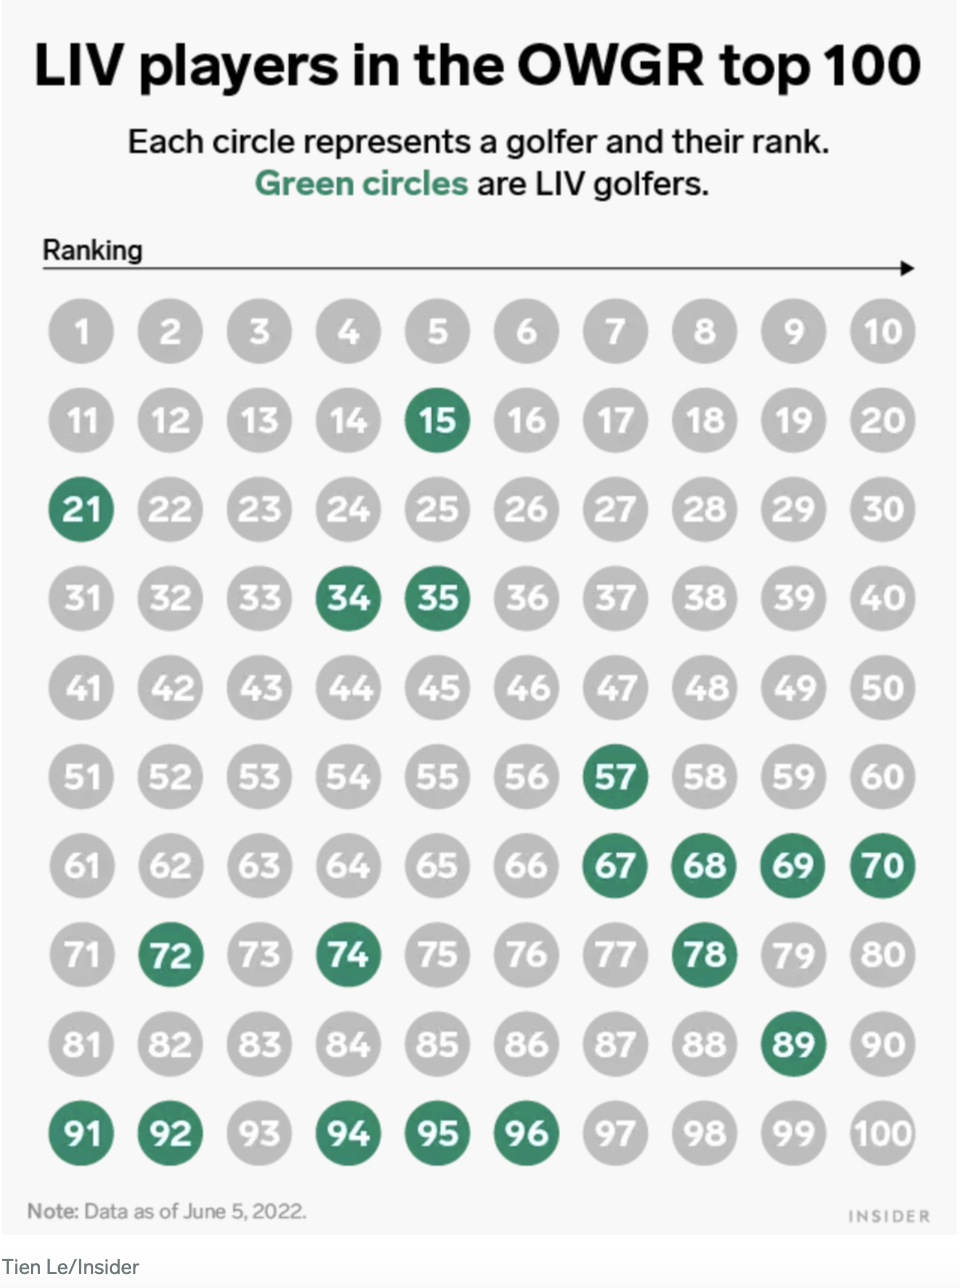
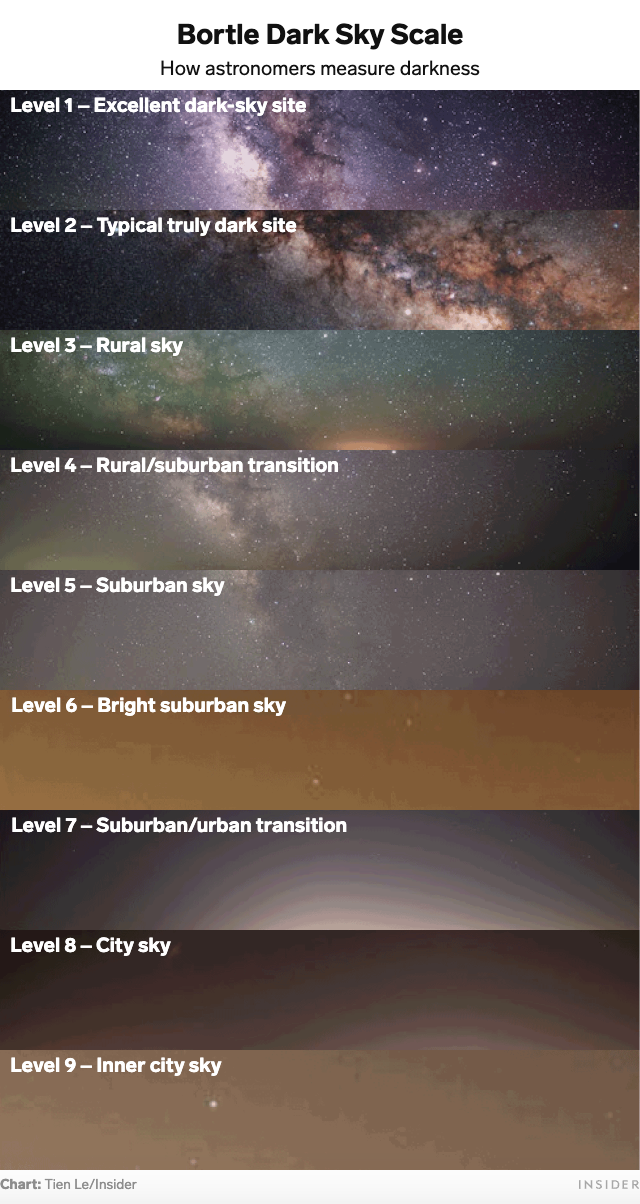
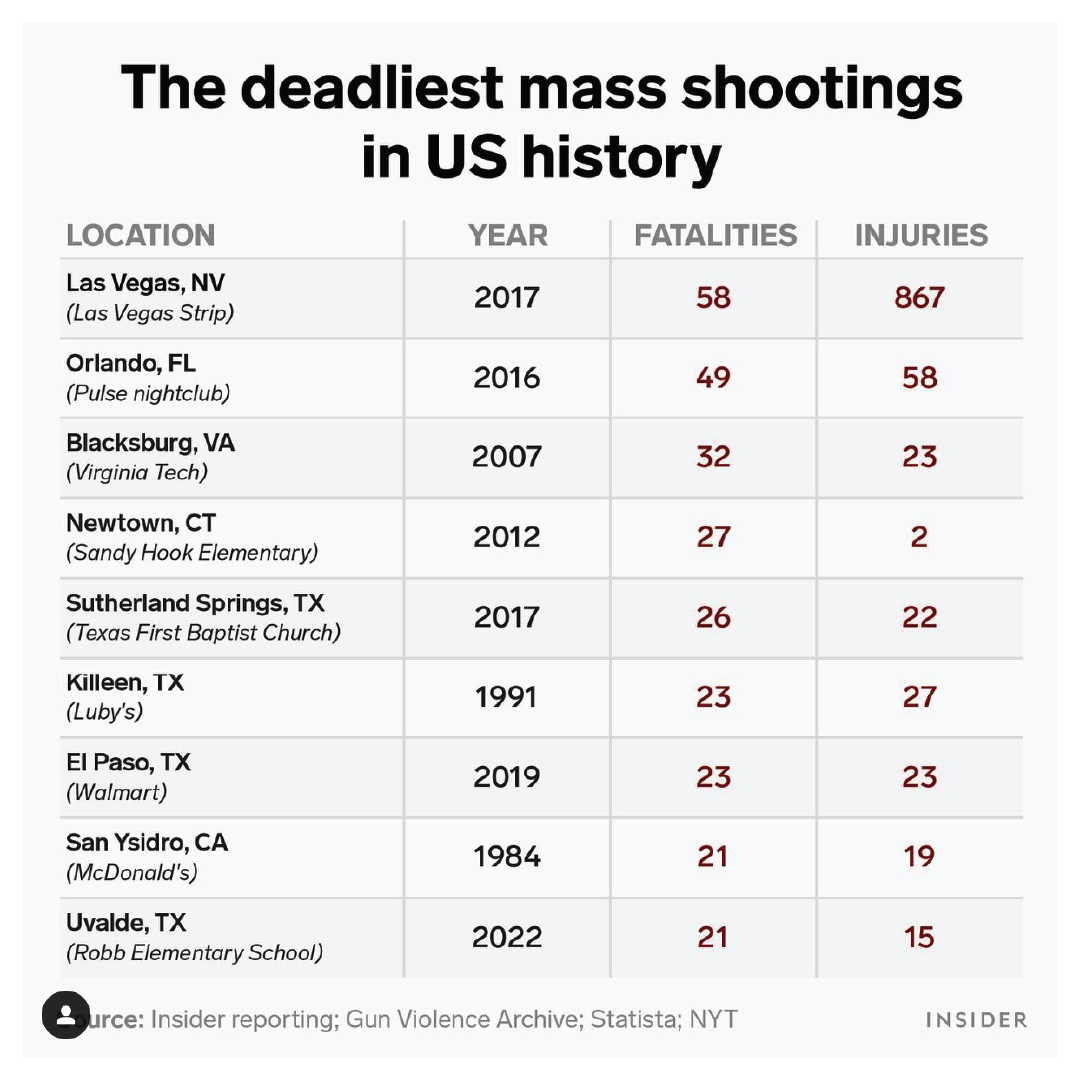
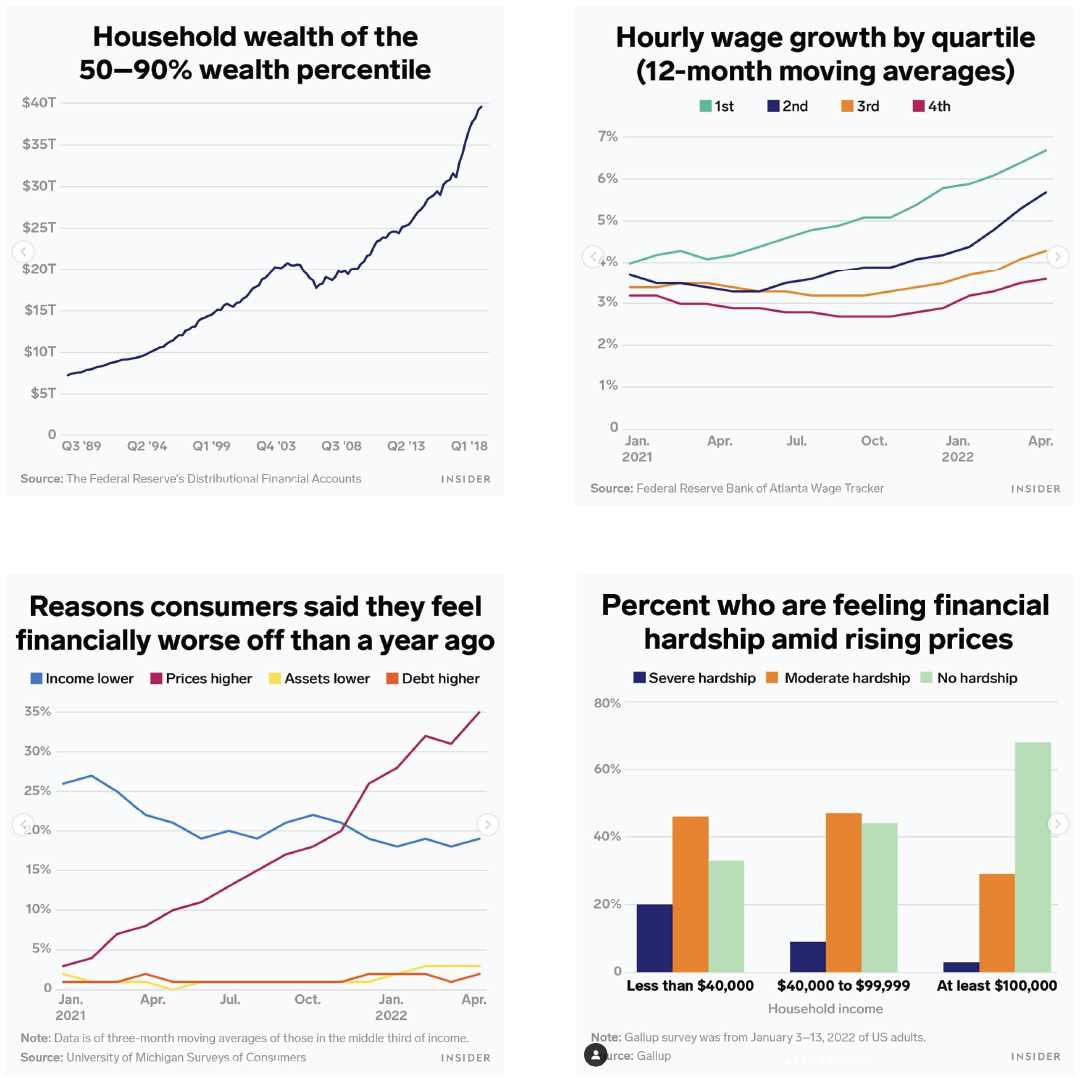
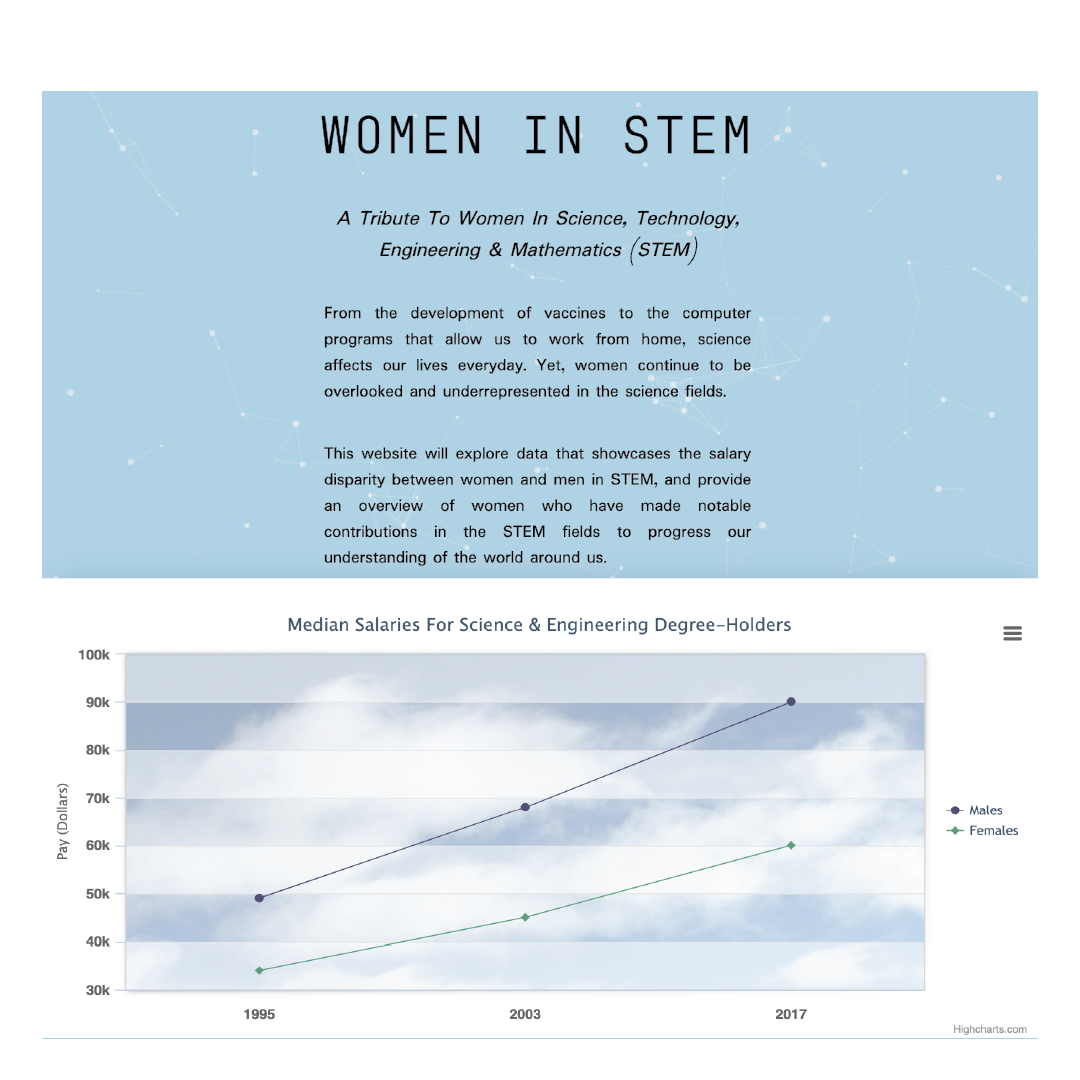
Data Visualization
Analysis using Google Sheets, Excel, Python, R
Visualizations created using Datawrapper, D3.js, RAWGraphs, Tableau, Adobe Illustrator
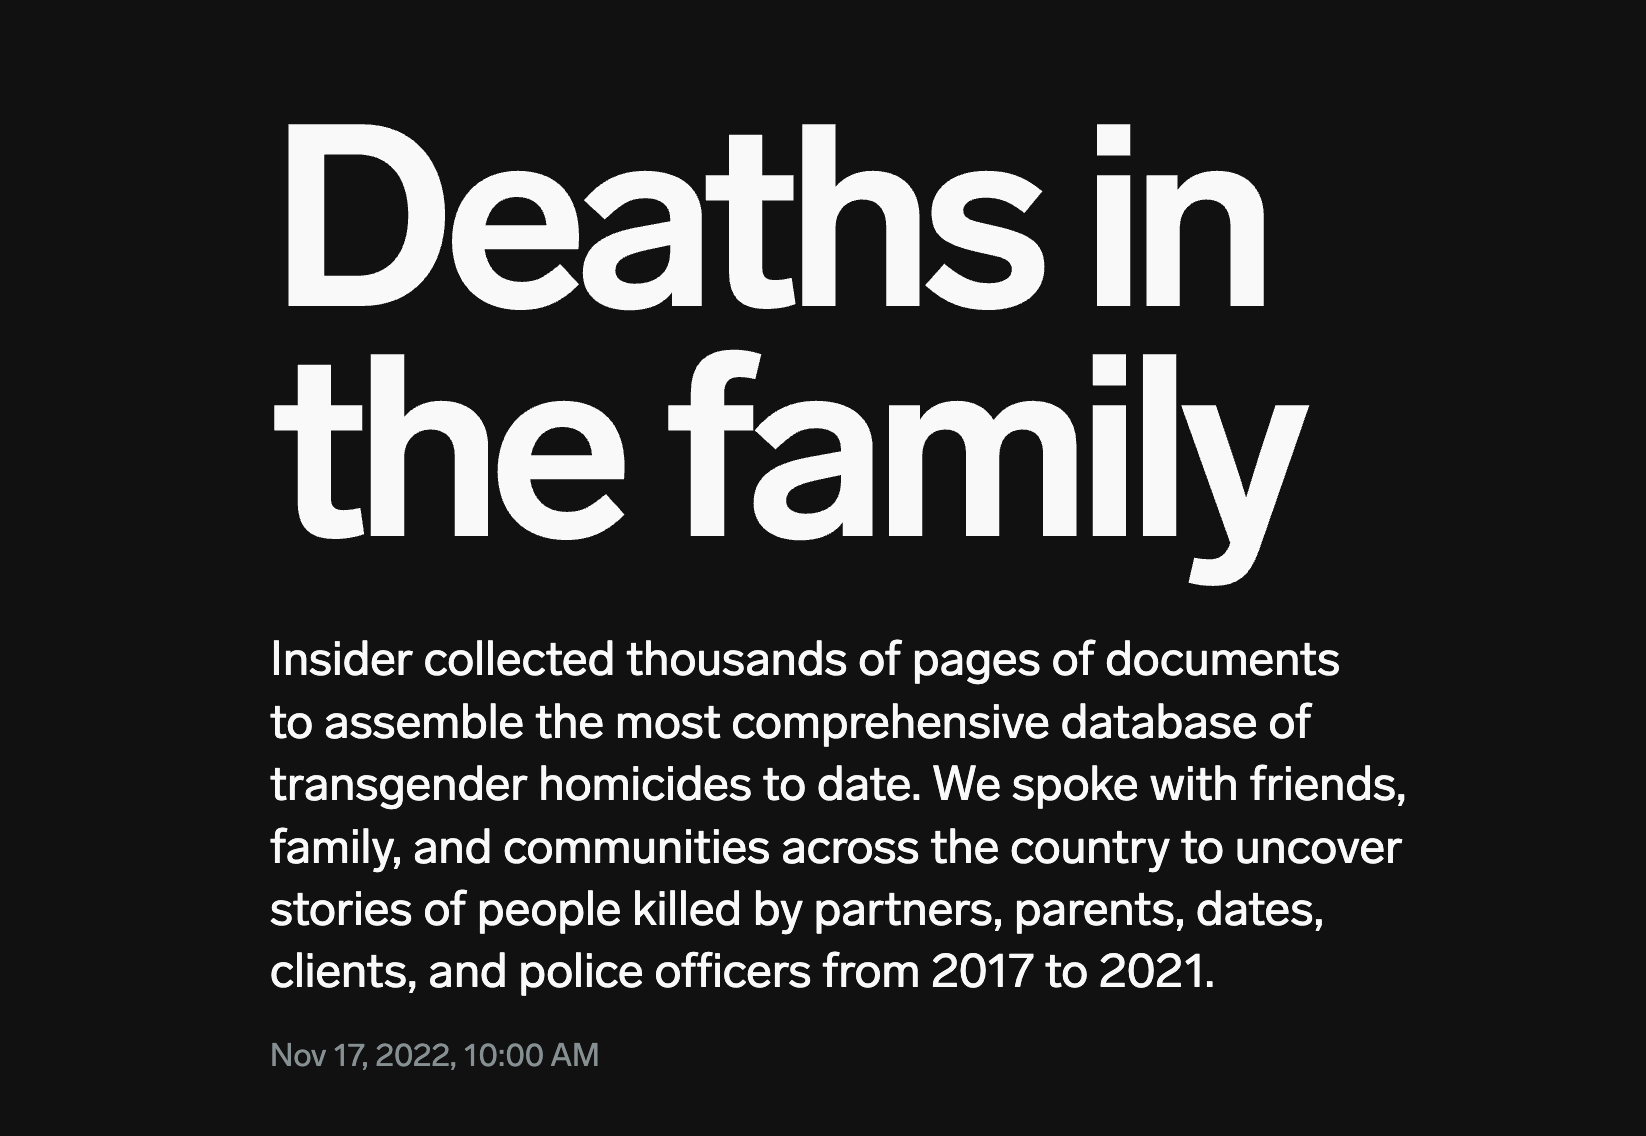
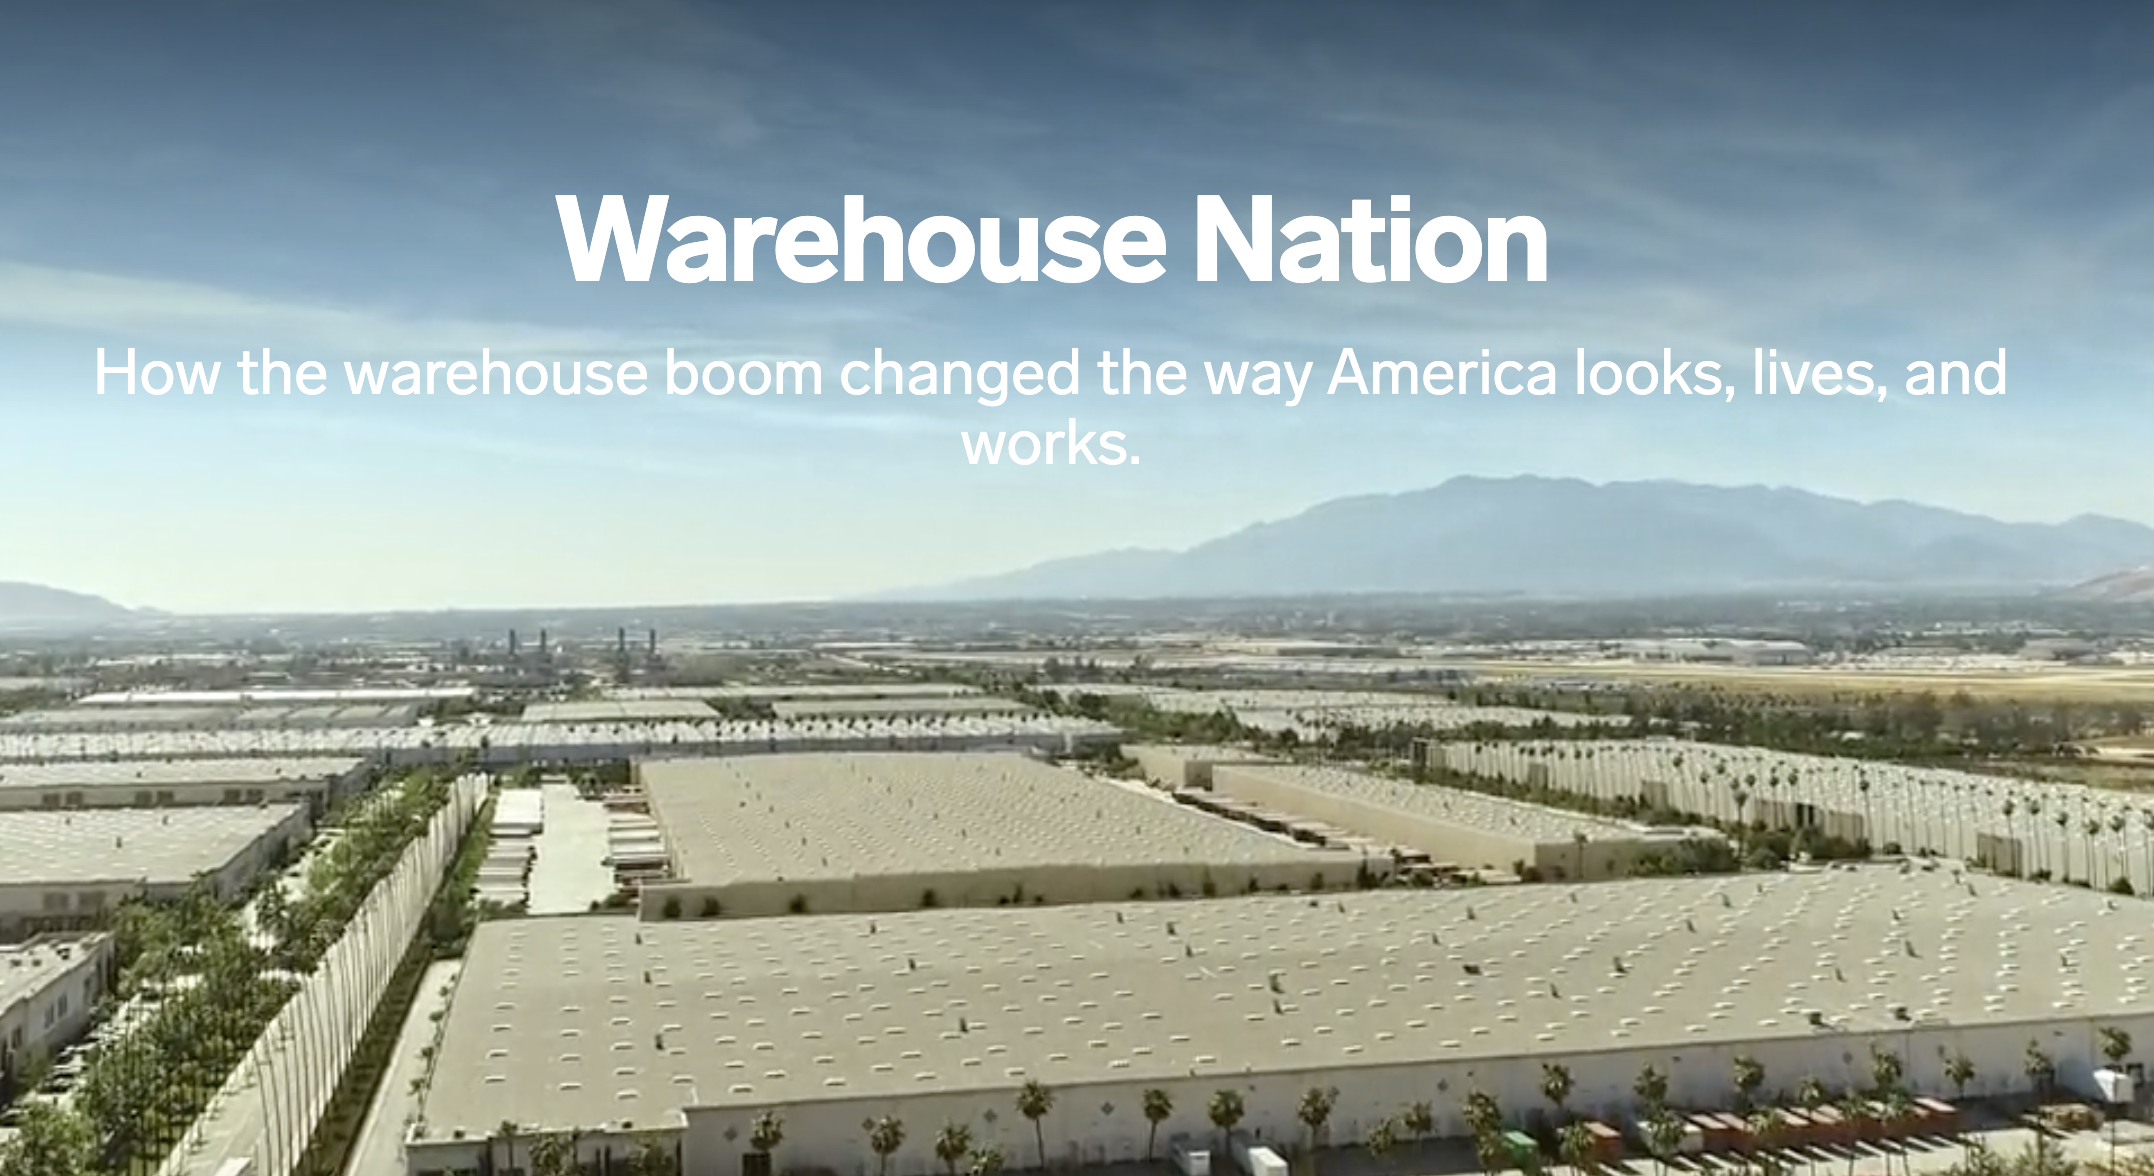
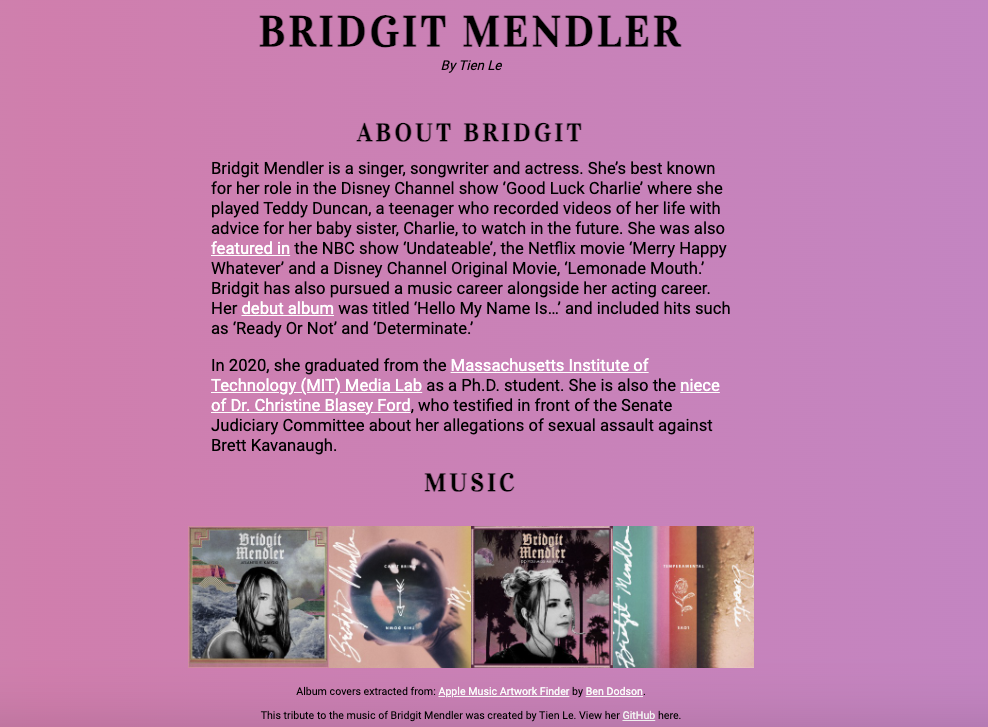
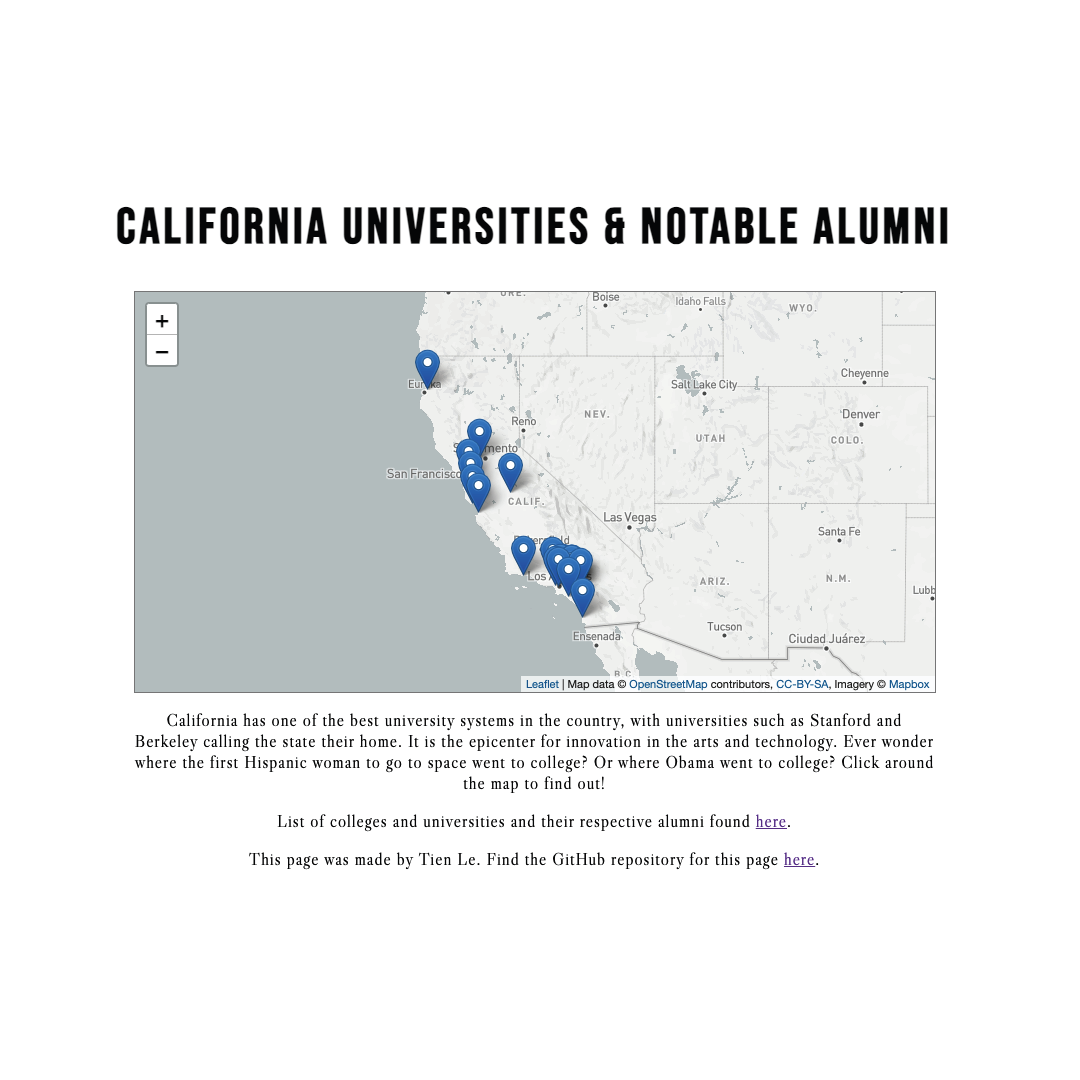
Team Projects
Projects where I worked with a larger team on design, development, graphics, and photos


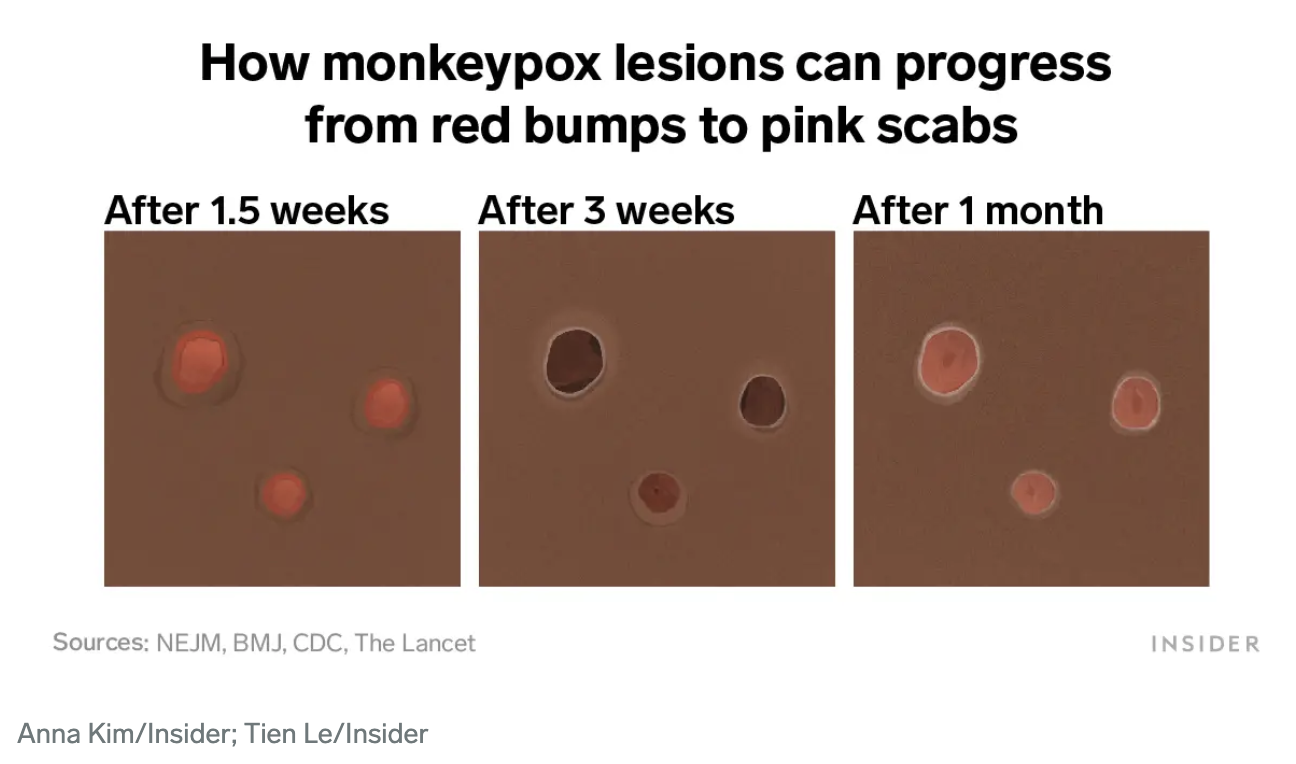
Adobe Illustrator
Examples of when I've created infographics, used ai2html, and transformed interactive visuals created by the Insider team into static visuals to be shared on social media

Code
Journalism
See more here: tientl.com/journalism